
I can't easily do owt.You could easily try the raw data is on this thread posted byThe Hare , get the raw data for the 6th of April, ask Grok to work out the things I mentioned, it won’t have a clue.
You are using an out of date browser. It may not display this or other websites correctly.
You should upgrade or use an alternative browser.
You should upgrade or use an alternative browser.
Hong Kong Speed Figures
- Thread starter The Hare
- Start date
you'll be good if you can understand this for that meeting. But here goesBeen looking at my ratings and looking to see where I can improve.
very happy with barrier trial ratings, don’t see how I can improve them now, had a slight issue with griffin horses without HKR messing with my calculations but sorted that now.
ability rating again I wouldn’t have the skills to make them any better.
I think my speed and sectional ratings for class 5 races are a pile of rubbish think it might be something to do with expectation being too low and so the actual looking too good against the expectation, going to have to look into it.
Overall all the data is there should be no excuse for not measuring things accurately, the meeting on 06/04/26 in Sha Tin got me thinking about more accurate going allowances, was windy that day and it was clear the wind assisted 1000m times but also stands to reason it would affect 1200m times differently than it would affect 2000m times.
If you have all the sections then it’s possible to create a going allowance for each section and apply in proportionately to each distance, that must be more accurate than a single going allowance for the round track.
Using my numbers for the meeting I had the last section -11.20 then going backwards from there -7.57, -3.47, -4.97 and +11.36
the straight course working backwards -11.20, -11.68, -12.04
Looking at that quite uniform on the straight course and last 400m on round course between -11.20 and -12.04
The evidence is nearly a mirror image when we get to the far side of the course slowing them by +11.36
It doesn’t seem right to use one going allowance, the 1200m work out -7.41 but the 2000m works out at -3.16 and the 1000m -11.56.
might try to incorporate sectional going allowances into the calculation of the going allowances for all distance at every meeting. Hopefully bring about some improvements.
This is an extreme example because of the wind, maybe most meetings would make negligible differences.

Attachments
Honestly it’s frustrating, the issue is you can’t evaluate a horse just by looking at times and sectional times.I can't easily do owt.
you need many other things to make sense of the raw data.
you need an expected time or rating
you need to have calculated from years of data accurate standard times, I have never ever seen accurate standard times published by anyone paid to do the job, I’ve seen times of nick Mordin, Simon Rowlands, Topspeed, split second and many others , they could all be torn apart for accuracy, it’s incredibly difficult, nobody has it perfect and never will.
then you need ratios for each section calculated from years of data , what percentage of the overall time should each section be for optimum efficiency.
when you have all this calculated then maybe you could feed this to grok with the raw data and ask it to come up with something, I still think it wouldn’t have a clue , like I always say each section is the product of others you can’t take them in isolation without adjusting for the effect the other sections would have.
like I say probably no one got all this worked out to a tee, grok I would bet against.
you'll be good if you can understand this for that meeting. But here goes
View attachment 166409

In the Purple my race specific differences, from what i do understand these correlate pretty close to your OHR ratio column, you missed the first race off your screenshot.
Last edited:
Grok is going to come up short but doing it's best.Honestly it’s frustrating, the issue is you can’t evaluate a horse just by looking at times and sectional times.
you need many other things to make sense of the raw data.
you need an expected time or rating
you need to have calculated from years of data accurate standard times, I have never ever seen accurate standard times published by anyone paid to do the job, I’ve seen times of nick Mordin, Simon Rowlands, Topspeed, split second and many others , they could all be torn apart for accuracy, it’s incredibly difficult, nobody has it perfect and never will.
then you need ratios for each section calculated from years of data , what percentage of the overall time should each section be for optimum efficiency.
when you have all this calculated then maybe you could feed this to grok with the raw data and ask it to come up with something, I still think it wouldn’t have a clue , like I always say each section is the product of others you can’t take them in isolation without adjusting for the effect the other sections would have.
like I say probably no one got all this worked out to a tee, grok I would bet against.
I once asked grok to calculate probabilities for a race, 15 times I had to tell it that they should add up to 1 and don’t, of course it grovelingly apologised and agreed I had caught it out and then proceeded to get it wrong 15 more times, I should have sent the conversation to Elon Musk.Grok is going to come up short but doing it's best.
Only thing that I could think of here is that the two girl apprentices consistently get some very fast trial times, think they both can ride at the minimum so they may innately be carrying a chunk less weight than someone like say Bowman in a T.very happy with barrier trial ratings, don’t see how I can improve them now, had a slight issue with griffin horses without HKR messing with my calculations but sorted that now.
Be extremely hard to factor this in I imagine though for every jock and impossible to get accurate.
Impossible to factor in weight carried because weights not published, i'm not worried about that really as not race pace so weight less effect, also not interested in the times in trials because no race pace, just a guide to how different rated horses compare, i think they work well enough. Not really a proper rating with weights and measures, just a predicted estimated OROnly thing that I could think of here is that the two girl apprentices consistently get some very fast trial times, think they both can ride at the minimum so they may innately be carrying a chunk less weight than someone like say Bowman in a T.
Be extremely hard to factor this in I imagine though for every jock and impossible to get accurate.
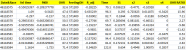
FWIW , so meeting is completeView attachment 166411
In the Purple my race specific differences, from what i do understand these correlate pretty close to your OHR ratio column, you missed the first race off your screenshot.
| 46118574 | -1.02666667 | -0.305416667 | 49.1 | ST1000 | -0.95107 | 56.5 | -0.15542 | -0.56583 | -0.30542 | 0 | -4.06 |
without a doubt you need to be able to produce and expected finish time and sectional times. you halfway there having created individual race exp/act tv I would avg between 6-8 runners per race as contributing to Finish time and sectional times and not always being the same number of runners thru each sectional. So like you I have an OHR rating that converts to predicted time, my OHR is based on Linear regression formulas with Y axis being the Tv adjusted finish time and X axis being the rating, but in tandem I would run the same Y axis TV adj time and X axis being raw time this needs to be done for every distance, again with OHR or Time adjustments you would need to filter using a very basic 2 Standard Deviations this is for Finish Times , sectionals are very different in how they are filtered. Normally the best adjustments in sectionals from one distance to another is thru Ratios not Linear regression, Ratios are more fluid when you have three or more sectionals working together. I wouldn't use proportions based on Time or Distance in sectionals. Your better to measure the variations between sectionals with the Finish time TV as a percentage, because you have some short sectionals that by their nature have a lot of variances that contributes to the whole race TV far greater then the distance or time proportion. I will add some more plus I did r1 predicted times for HV1000, I will describe how each sectional fitted together and the friction between those sectionalsIf you have the data then you can produce anything, I’m not sure Grok can just look at the times and do it though.
You need an expected figure on the same scale as your speed/sectional ratings to compare expectation v actual, you also imo opinion need to adjust each section for being affected by overall time, it’s easier to run a fast section if you have run many slow sections.
It’s complicated working out how to approach it, you can build sheets in excel that can calculate anything if you have an idea of what you want to calculate. I find it fascinating, way more than actually betting. Most of the time I calculate all these things and don’t have enough time to look at them. HK is a great place to test anything out with data. I would love to see the kind of stuff that real clever people calculate and be able to understand what they are doing. I often readARAZI91 stuff, but most of that is above my understanding, same with W woof43 on this thread, he looks very advanced with his predictive times.
If I can’t improve to a very high standard with HK data then I wouldn’t even think of looking at U.K. again as that would be much tougher and data isn’t available in a workable format. So just practicing on HK.

If you do develop sectional TV's you will be able to create Pace Distortion figure that will provide a pure race shape effect,
Pace Distortion (PD) will measure how much the early pace was inflated or deflated the final time, independent of track speed and horse ability.
Negative PD = fast pace hurt the final time.
Positive PD = soft pace helped the final time.
I posted R1 the runner #5 macanese master highlights to a degree the PD influence this part is created with help AI, the following jpg just shows the 6/4 meeting I added the PD column, whilst underneath is the HV1000 sectional data and the regression that gave the supporting figures, it has changed slightly as each time data hits the database it makes adjustments. Also in regard to data and how much when Handicapping that database will only hold data only all the current active runners, once a runner retires or is inactive they drop out Handicapping data has to be relevant only to those competing runners, whereas the Wagering database which is driven by how the public assess situations goes back years.
# **MACANESE MASTER EXAMPLE (HISTORICAL ONLY)**
When you see:
PD = -0.359
It means:
- The early pace was **too fast**
- The race shape **hurt** him
- His final time is **slower than it should be**
- His performance is **better than the raw time**
When you see:
PD = +0.121
It means:
- The early pace was **soft**
- The race shape **helped** him
- His final time is **faster than it should be**
- His performance is **worse than the raw time**
This is exactly how the model should interpret it.

Pace Distortion (PD) will measure how much the early pace was inflated or deflated the final time, independent of track speed and horse ability.
Negative PD = fast pace hurt the final time.
Positive PD = soft pace helped the final time.
I posted R1 the runner #5 macanese master highlights to a degree the PD influence this part is created with help AI, the following jpg just shows the 6/4 meeting I added the PD column, whilst underneath is the HV1000 sectional data and the regression that gave the supporting figures, it has changed slightly as each time data hits the database it makes adjustments. Also in regard to data and how much when Handicapping that database will only hold data only all the current active runners, once a runner retires or is inactive they drop out Handicapping data has to be relevant only to those competing runners, whereas the Wagering database which is driven by how the public assess situations goes back years.
#
**MACANESE MASTER EXAMPLE (HISTORICAL ONLY)**When you see:
PD = -0.359
It means:
- The early pace was **too fast**
- The race shape **hurt** him
- His final time is **slower than it should be**
- His performance is **better than the raw time**
When you see:
PD = +0.121
It means:
- The early pace was **soft**
- The race shape **helped** him
- His final time is **faster than it should be**
- His performance is **worse than the raw time**
This is exactly how the model should interpret it.
Here is the general flow chart although we talk about Pace Distortion you will also see as it flows down Performance Delta is another cross hair in describing a performance numerically
┌──────────────────────┐
│ RAW TIME │
│ (official race time)│
└───────────┬──────────┘
│
▼
┌──────────────────────┐
│ TRACK VARIANT (TV) │
│ Adjust for track speed│
└───────────┬──────────┘
│
▼
┌────────────────────────────┐
│ TV‑ADJUSTED TIME │
│ (raw time corrected for TV)│
└───────────┬────────────────┘
│
▼
┌────────────────────────────┐
│ PACE DISTORTION (PD) │
│ Adjust for race‑shape bias │
│ • Negative = fast pace │
│ • Positive = soft pace │
└───────────┬────────────────┘
│
▼
┌────────────────────────────┐
│ MODEL TIME │
│ (TV + PD fully corrected) │
└───────────┬────────────────┘
│
▼
┌────────────────────────────┐
│ PERFORMANCE DELTA │
│ Difference between Model │
│ Time and your reference │
│ standard (class/benchmark) │
└───────────┬────────────────┘
│
▼
┌────────────────────────────┐
│ FINAL RATING OUTPUT │
│ Convert Delta → Rating │
│ Apply weight/draw/trouble │
└────────────────────────────┘
┌──────────────────────┐
│ RAW TIME │
│ (official race time)│
└───────────┬──────────┘
│
▼
┌──────────────────────┐
│ TRACK VARIANT (TV) │
│ Adjust for track speed│
└───────────┬──────────┘
│
▼
┌────────────────────────────┐
│ TV‑ADJUSTED TIME │
│ (raw time corrected for TV)│
└───────────┬────────────────┘
│
▼
┌────────────────────────────┐
│ PACE DISTORTION (PD) │
│ Adjust for race‑shape bias │
│ • Negative = fast pace │
│ • Positive = soft pace │
└───────────┬────────────────┘
│
▼
┌────────────────────────────┐
│ MODEL TIME │
│ (TV + PD fully corrected) │
└───────────┬────────────────┘
│
▼
┌────────────────────────────┐
│ PERFORMANCE DELTA │
│ Difference between Model │
│ Time and your reference │
│ standard (class/benchmark) │
└───────────┬────────────────┘
│
▼
┌────────────────────────────┐
│ FINAL RATING OUTPUT │
│ Convert Delta → Rating │
│ Apply weight/draw/trouble │
└────────────────────────────┘
the Pace Distortion is the best indicator IMHO. What your looking for is a figure 0-.05 means a slightly fast but neutral speed, leaders not punished , closers not advantaged, the next range -.05 to -.20 genuine fast, not destructive , leaders work midfielders get a fair chance, anything >-.30 the back markers are advantaged, then all scores in the positive range soft pace , sprint home leaders advantaged etcHi W woof43, in general do you find that a positive final time is more likely when matched to efficiency ?
here is #5 r1 tonight it will run well if its a soft pace. but it needs to lead, better run home adj times are all on a soft pace, uncontested lead, breather mid race, but my program has it running fast contested multiple runners handy

just looked at r5, the 11 and 9 looked to already be found, both look to be able to race close lead or behind the lead, 5 is my selection, has the figures to be able to win, but where it races is the real problem and how much disadvantage / friction thru the turns is going to cost it time

Last night racing at Sha Tin with the wind directions, It was telling the difference when the runners were running into the breeze as opposed, and how swiftly the markets were atuned to the prospect of them running slow a S1 or an S1 with some speed.
From Discord discussion.
jk138_ — 16/04/2026 9:26 AMThursday, 16 April 2026 9:26 AM
I don't know about you king, but the tempos the last month or 6 weeks in a lot of these races have been absolute walks. What's going on over
[9:27 AM]Thursday, 16 April 2026 9:27 AM
The track biases have been so more pronounced this season. Add in the wind as well and it's been up and in for a good few months
[9:27 AM]Thursday, 16 April 2026 9:27 AM
I presume when it's Ellis and the syndicates know it's an on speed horse or expected to lead, they know he walks. Same thing with Chung on Cruz
[9:28 AM]Thursday, 16 April 2026 9:28 AM
Chung did it last week on General Redwood
My reply in Discord.
It's always interesting to look at the those early tempo's at the race/horse level and meeting levels, i use a pace distortion figure at the horse level and a exp/act tv at the race level, the last two ST meetings S1 have been impacted by wind, normally the jockeys will not fight the track bias , and those that have fought the bias and won have been supported. the 12/4 meeting Level my s1 TV was a +.133 meaning s1 is slow and getting impacted, at the Horse level with pace distortion PD = +.02 meaning in most instances they didnt fight the track bias , but on the 6/4 the TV = .258 this is slow but at the horse level it was -.078 meaning the jockeys ignored the track bias and raced with real intent and were wagered , whereas HV 8/4 TV s1 = -.114 PD = -.139 the jockeys rode with the bias which they normally do at HV for obvious reasons, 25/3 HV S1 was very fast -.256 jockeys rode with it, on the 18/3 HV S1 =-.117 fast early but in this case there was a lot of intent for some runners that were wagered to go out quicker so the PD=-.183.