Dave
Gelding
RaceIQ Explained, Part 3: The Finish
Finishing speed, the par for it, top speed, and the trap that catches most people.
RaceIQ Explained is a series for anyone who has looked at the RaceIQ figures on Racing TV and not known where to start. Part 1 covered the sectional times and the shape of a race. Part 2 covered the time figures. This part covers the finish. From this part on, the series is free to everyone, and Parts 1 and 2 are now open too.
Part 2 homework: Velvet Rhythm
The question was whether Velvet Rhythm’s win in the 17:20 at Newmarket on Guineas day was a good win or a weak one. He led after the first furlong, was headed by Splash for the next two, was back in front by halfway and won by three-quarters of a length at 14/1. The race was run at a Very Fast pace, the strongest early pace against its norm of any race on the card, and it was the weakest race on the card on time.My answer is that it was a good win, better than the time suggests.
What the pace did. A Very Fast pace means the horses near the front used too much early and the race fell apart at the end. That is why the time was poor: the fastest final furlong anyone ran was 13.11s, because almost the whole field slowed down. A weak time in a race like that says more about the shape of the race than about the horses in it.
Who it suited. Races run like that are set up for horses held up off the pace. The second, Thaluna, was 9th at halfway and had the best finish in the race. The third, Nanoscience, was 6th at halfway.
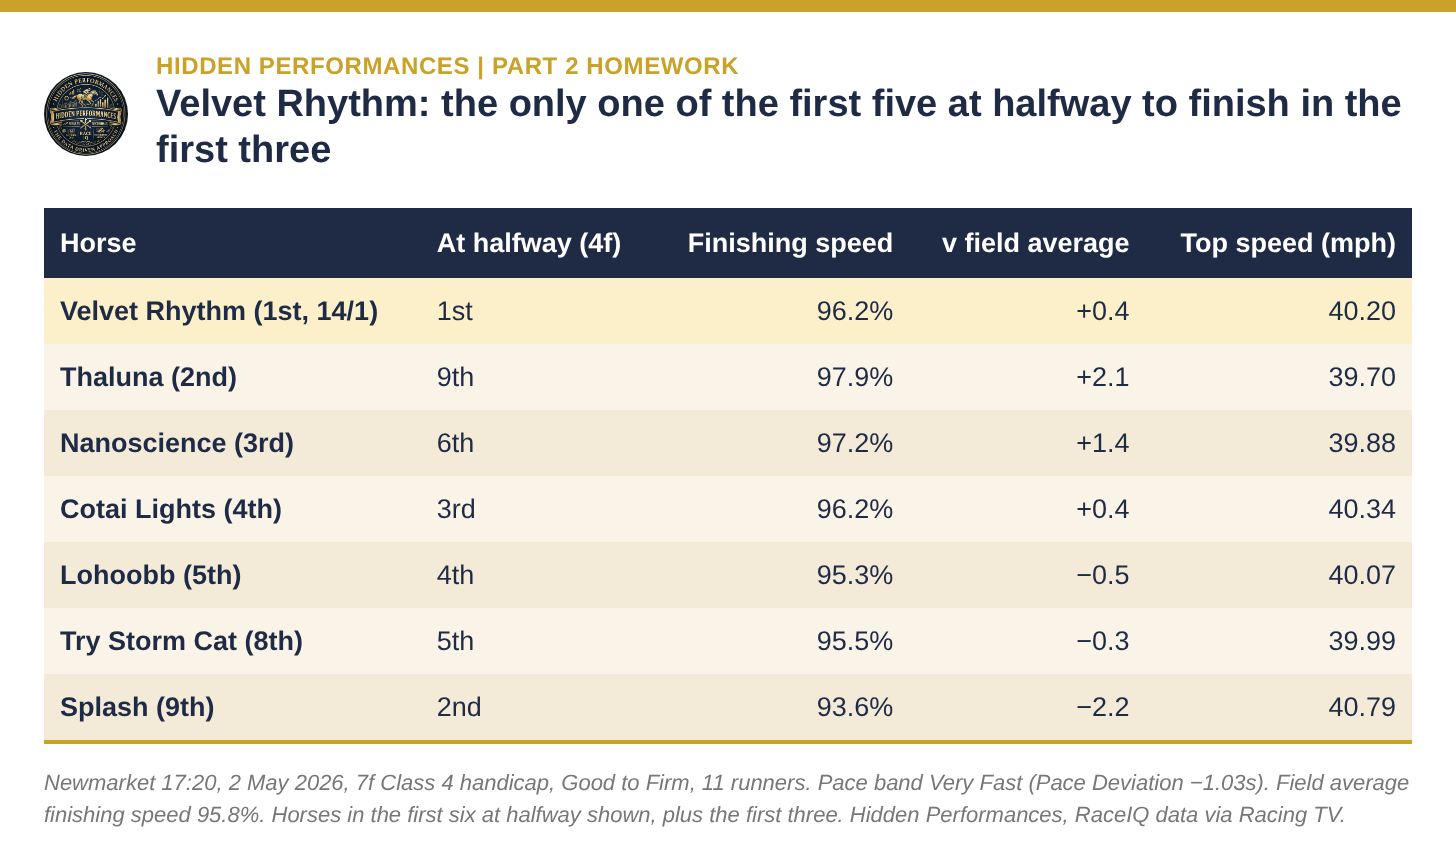
What happened to the others up with the pace. Splash, second at halfway, finished 9th, beaten more than seven lengths. Cotai Lights, third at halfway, finished 4th. Lohoobb and Try Storm Cat, 4th and 5th at halfway, finished 5th and 8th. Of the first five at halfway, Velvet Rhythm was the only one to finish in the first three, and he was the one doing the most work.
His finish. His finishing speed was 96.2%, which looks poor against a normal race. But the field average was 95.8%, so he slowed down a little less than the field while doing most of the leading. A horse that sets a Very Fast pace and still finishes at the field’s rate has run a strong race.
What he did next. He won at Catterick 19 days later at evens, then won there twice more in June and July, at 6/1 and 5/4: three wins from his next five runs.
The lesson leads straight into this part. The horses that caught the eye at the finish, the closers, were the ones the race suited. The horse whose figures looked ordinary was the one that had run the best race.
What finishing speed measures
RaceIQ’s Finishing Speed Percentage (FSP) compares how fast a horse ran the end of the race with its own average speed for the whole race. On the Flat it uses the last two furlongs in races up to a mile and 110 yards, and the last three in longer races. A figure of 102% means the horse ran the final furlongs 2% faster than its average for the race.- 100% means the horse finished at exactly its average speed.
- Above 100% means it finished faster than its average: it quickened, or kept going while having saved something early.
- Below 100% means it slowed down at the end.
Rule one: read it against the field
In Part 1 you saw that the average finishing speed in the Guineas was 94.5% and in the slowly run Goodwood handicap 106.8%. That isn’t a quirk of two races. It is how finishing speed works, and it is the most important thing to know about it.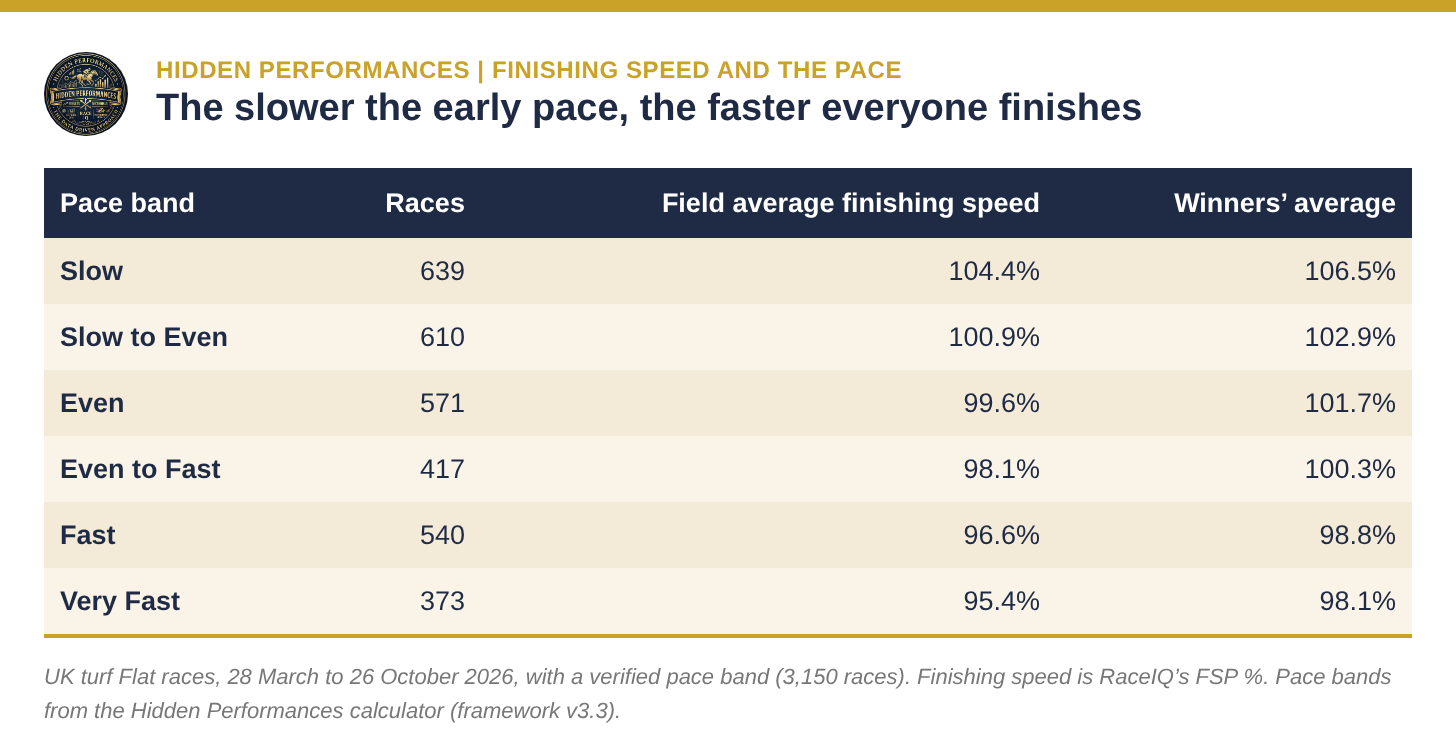
Across more than 3,000 turf races this season, the field average moves in a straight line with the pace. In a Slow race the whole field finishes fast, because nobody used much early: the average is over 104%. In a Very Fast race the whole field slows down, because everybody used too much: the average is about 95%. Winners follow the same pattern, two or three points above the field.
So a finishing speed of 102% means very little on its own. In a Very Fast race it would be one of the best finishes in the field. In a Slow race it would be below average. Before you look at any horse’s finishing speed, look at the field’s.
That is why my reports always give a horse’s finishing speed against the field average rather than on its own. As a rough guide, I count a finish as standing out when it is three points or more above the field in a sprint, four in a middle-distance race and five over a staying trip.
Rule two: read it against the track
RaceIQ has its own par for finishing speed at every course and distance, and the same par sits behind the colours on the Sectionals tab, from Very Slow to Very Fast. Racing TV says the pars come from the sectionals of winners in races with the best Time Index scores, because the fastest races are usually won by horses running most efficiently. It quotes a par of around 103% for Epsom’s six furlongs, and around 112% for a mile and a half that starts steeply uphill.RaceIQ doesn’t publish the full list of its pars, so I have built my own from my databases in the same way: the finishing speed a winner of a race run in a good time typically records at each course and trip.
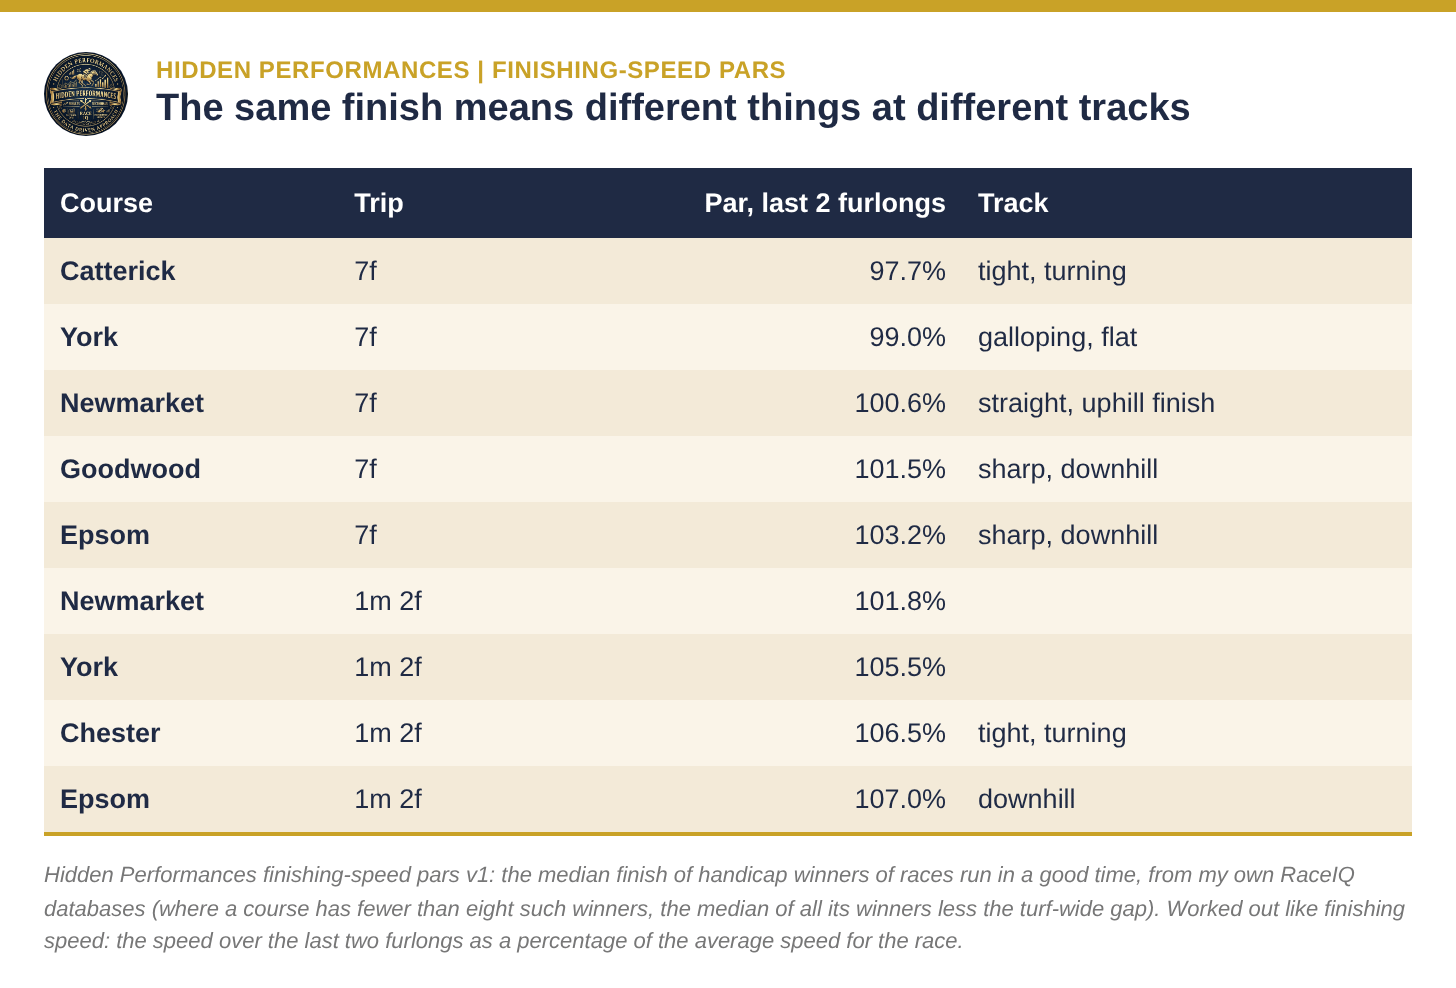
The differences are bigger than most people expect. Over seven furlongs, a good winner at Catterick finishes at under 98%, while a good winner at Epsom finishes at over 103%. Epsom’s last two furlongs run downhill and then level, so everybody finishes fast there. Catterick is tight and turning, and races there are often won by horses that went hard early and held on.
So a finish of 101% would be a strong one at Catterick and a weak one at Epsom. If you compare horses from different tracks on finishing speed alone, you are partly comparing the tracks.
Top speed
RaceIQ’s top speed is the fastest speed a horse reached at any point in the race, in miles per hour. On the Flat, most horses top out between about 37 and 43mph.On its own it doesn’t tell you when the horse reached that speed, and that matters. A horse can reach its top speed early, chasing the lead, and then pay for it, or it can reach it in the final furlong while running on. Splash in the homework race had the highest top speed in the field, 40.79mph, and finished 9th. His fastest furlong by a distance was the second, run as he went past Velvet Rhythm into the lead, so that is almost certainly where he reached it.
For that reason I used to give top speed little weight. My data says I was wrong to, and it is the most interesting finding in this post.
The trap, and what the market misses
Here is what happened next time to three kinds of beaten horse, on turf this season and across two years on the All-Weather.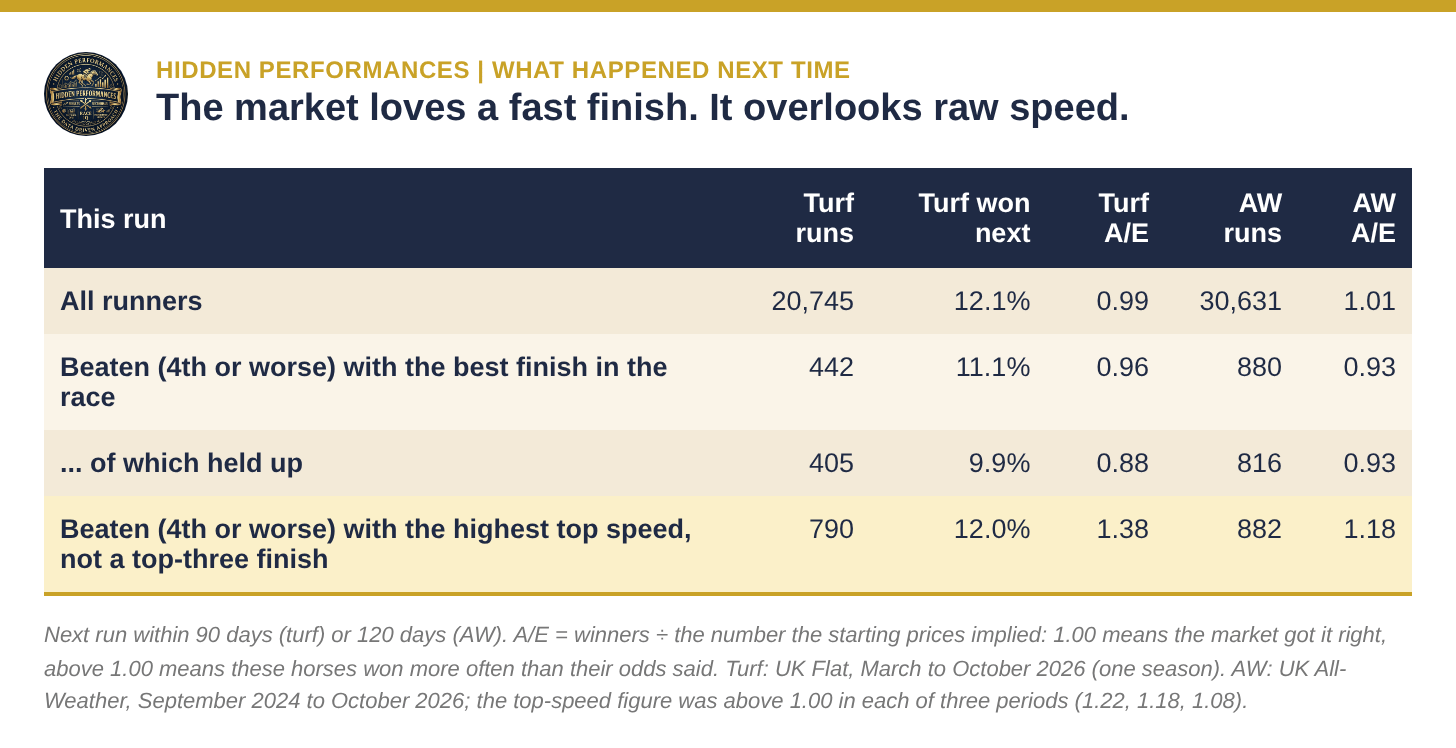
The horse with the best finish. A horse that finishes 4th or worse but has the fastest finish in the race is the classic eye-catcher. It is exactly the horse people put in their notebooks. It didn’t beat the market next time, on turf or on the All-Weather. On turf, those that came from the back of the field did worse still. The market sees these horses as clearly as anyone, and prices them accordingly.
Part of the reason is the trap from Part 1. In a slowly run race, nearly every horse finishes fast, and the horse at the back finishes fastest because it has done least. Its finish looks like hidden ability, but it is mostly the shape of the race. Even when the pace was strong, a closer often finishes fast because it passed horses that were stopping, as Oxagon did in the Guineas.
The horse with the highest top speed. Now take the beaten horse that reached the highest speed in the race but didn’t have one of the three best finishes. Usually it was up with the pace, like Splash, and spent its speed in the first half of the race. In the form book it is just a horse that was beaten seven or eight lengths, and next time it tends to go off a bigger price than average.
Those horses won about as often as all runners next time, but at prices that underrated them. On turf they won 38% more often than their starting prices implied (an A/E of 1.38 from 790 runs). On the All-Weather the figure was 1.18 from 882 runs, and it was above 1.00 in each of the three periods I split those two years into.
Two cautions. The turf figure comes from one season, and none of these figures has been tested on races run after I found it. Treat it as a strong pointer, not a system. But the same pattern runs through other things I have tested: on turf, beaten horses that were up with the pace and finished slowly have beaten the market, while late closers have not.
The general lesson is the one Velvet Rhythm showed. The market and the form book both reward the horse that catches the eye at the finish. The horse that showed the most speed in the race and then paid for it is the one they tend to undervalue.
Try it yourself
- Open the result on Racing TV and go to the RaceiQ Comparison tab. Choose Finishing Speed %.
- Work out the field average, roughly, by eye. Is the field finishing above or below 100%? That tells you how the race was run before you look at any one horse.
- Find the horses three or more points above the field average (four or five in longer races). Those are the finishes that stood out.
- For each of them, check where it was at halfway. A horse that finished fast from the back of a slowly run race has done little. A horse that finished well from up with a strong pace has done a lot.
- Now switch the metric to Top Speed. Note any beaten horse near the top of that list that didn’t have a good finish. Look at its sectionals to see where it reached that speed. If it was early, while racing with or chasing the leader, it is worth watching next time.
Your homework horse
Splash ran in the same race as Velvet Rhythm. He had the highest top speed in the field, was second at halfway and finished 9th, beaten about seven and a quarter lengths, at 11/1.His furlongs after the start were 11.11s, 11.45s, 11.66s, 11.98s, 12.35s and 14.38s. The 11.11s second furlong was the fastest any horse ran at any point in the race. His finishing speed was 93.6%, more than two points below the field.
Was it a bad run, or a hidden one? Think about where he spent his speed, what the race did to the other horses near the front, and how he compares with Velvet Rhythm, the horse he took on for the lead. Part 4 covers the figures that answer it best: the 0–20mph time, which measures how quickly a horse gets going, and stride length and stride frequency. My answer, and what he did next, is in Part 4.
The terms used in this post
- Finishing speed (FSP %): the horse’s speed over the last two furlongs (three in races over a mile and 110 yards) as a percentage of its average speed for the race. 100% means it finished at its average speed.
- Field average finishing speed: the average for every runner in the race. It shows how the race was run: high in slowly run races, low in fast-run ones.
- Standout finish: my guide for a finish that really stood out: 3 points above the field average in a sprint, 4 in a middle-distance race, 5 over a staying trip.
- Finishing-speed par: what a winner of a race run in a good time records at that course and trip. RaceIQ has its own; mine are built the same way from my databases. It allows for the shape of the track.
- FSP rank: where a horse’s finishing speed ranks in the field. 1 is the best finish in the race.
- Top speed: the fastest speed the horse reached at any point in the race, in mph. Always check where in the race it came.
- A/E (actual over expected): winners divided by the number the starting prices implied. 1.00 means the market priced them correctly; above 1.00 means they won more often than their odds suggested.
- The slow-race trap: in a slowly run race nearly every horse finishes fast, and the horse at the back finishes fastest because it has done least.
The rest of the series
- Part 4: Energy and efficiency. The 0–20mph time, stride length and stride frequency, and Splash’s answer.
- Part 5: One race, start to finish. Everything from Parts 1 to 4 put together, and how I decide a horse ran better than its result.
RaceIQ Explained, Part 3: The Finish
Finishing speed, the par for it, top speed, and the trap that catches most people.
 hiddenperformances.substack.com
Data: RaceIQ via Racing TV (sectional times, positions, finishing speed and top speed). RaceIQ definitions and par examples from Racing TV’s RaceiQ glossary and Par Sectionals pages. Pace bands, finishing-speed pars, field averages and next-run figures are my own calculations (Hidden Performances calculator, framework v3.3, and pars v1), from UK turf Flat races between 28 March and 26 October 2026 and UK All-Weather races between September 2024 and October 2026. Starting prices and beaten distances from the official results.
Last edited:




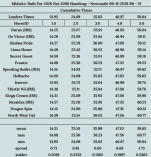
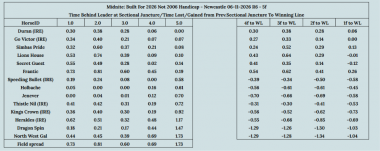
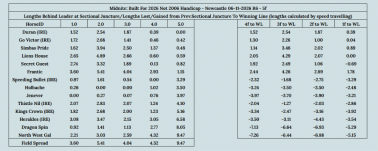
 think some of your finishing speed%'s are way "off" and would suggest using 3f for races at a mile or over and even last 4f for long distance races. I'm sure Simon Rowlands recommends this as it's his metric - using only 2f for all will add some skew to your pars because at 5f your using 40% of the race but at 10f your only using 20% and at 12f 16.7%


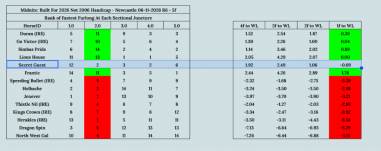
 green tactical advantage highlight. The early exertion caused a total pace collapse. Every horse that raced prominently finished with a Finishing Speed Percentage (FSP) below 100% (Speeding Bullet 99.74%, Holbache 99.33%, Jenever 99.15%). This setup mathematically handed the race to the closers.