


Dave
Gelding
RaceIQ Explained, Part 1: Reading the Sectionals
What RaceIQ records, and how to read the early, middle and closing pace of a race.
RaceIQ Explained is a new series for anyone who has looked at the RaceIQ figures on Racing TV and not known where to start. It assumes no knowledge of sectional times. Each part introduces a few of the figures, says what they mean, and shows them working on real races. This first part covers the Flat. I’ll do the same for the jumps figures later.
Why bother with sectionals?
A result tells you the order the horses crossed the line and the distances between them. It doesn’t tell you how they got there. Two horses beaten three lengths can have run completely different races. One might have been taken on for the lead, gone too fast early and hung on. The other might have been last for most of the race and finished better than anything. The form book records the two runs the same way. The sectional times don’t.Every horse has a limited amount of energy to spend over a race. Sectionals show where it was spent. Once you can see that, you can tell which runs were better or worse than the result suggests, and that is where the value in form study lies.
What RaceIQ is
RaceIQ is the set of race figures that Racing TV and ITV Racing use in their coverage. It was developed by Racecourse Media Group with the data company Ellipse, and it is built from GPS tracking of every runner. Since March 2025 it has been free on racingtv.com and the Racing TV app, with no login needed. It covers every British race since March 2023 and every Irish race since January 2024.Open any result on Racing TV and you’ll find three tabs:
- Result: the finishing order, with a “View Data” button under each horse showing its main RaceIQ figures and how they rank in the field.
- RaceiQ Comparison: one figure at a time across the whole field, in finishing order.
- Sectionals: the furlong-by-furlong times. This is where this series starts.
The series
- Part 1 (this post): Reading the sectionals. The three numbers RaceIQ gives every horse at every furlong, and how to use them to see the early, middle and closing pace of a race.
- Part 2: Was it a good race? Par Time, Time Index, the meeting average and why the ground matters.
- Part 3: The finish. Finishing Speed Percentage (FSP), the par for it, top speed, and the trap that catches most people new to these figures.
- Part 4: Energy and efficiency. 0–20mph, stride length and stride frequency, and why even running usually wins.
- Part 5: Putting it together. One race read from start to finish, and how I decide that a horse ran better than its result.
The three numbers on the Sectionals tab
A furlong is 220 yards, and there are eight in a mile. RaceIQ splits every race into furlongs and gives each horse three numbers for each one:- Sectional time: how long the horse took to run that furlong, in seconds. Lower is faster.
- Position: where it was in the race at the end of that furlong.
- Time behind the leader: how far behind the leader it was at that point, in seconds. The leader shows +0.00.
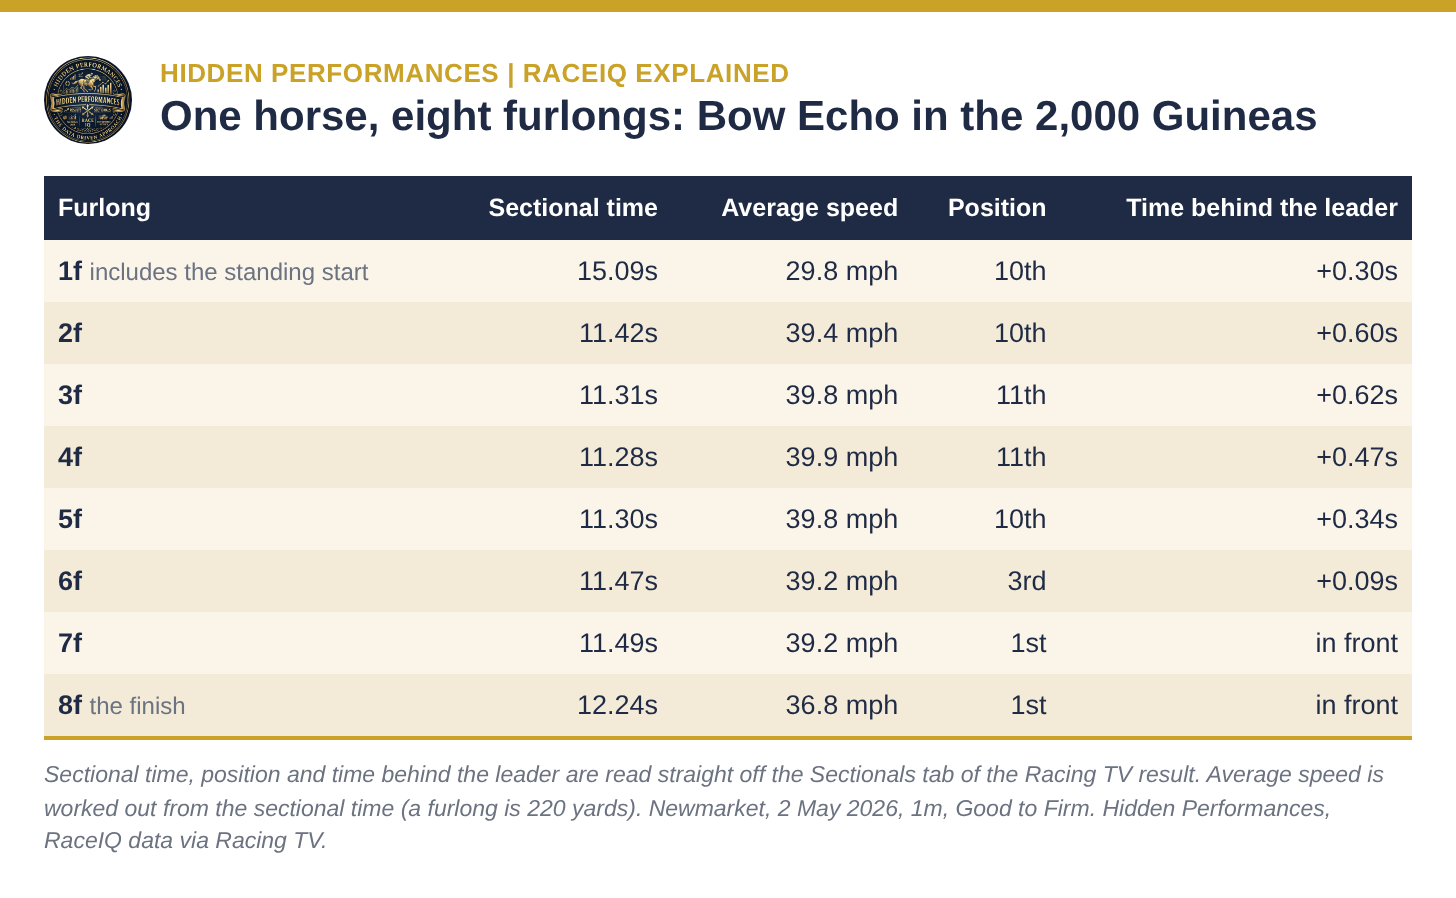
Three things are worth noticing straight away.
Ignore the first furlong. It includes the standing start, so every horse’s first furlong is much slower than the rest. Racing TV leaves it off its own pace graph for the same reason.
Small numbers are big distances. At racing speed a second is worth around six lengths, so a tenth of a second is roughly half a length. Bow Echo was 0.62s behind the leader after three furlongs, about four lengths, and he was 11th.
His times barely changed. From the second furlong to the seventh, every furlong was between 11.28s and 11.49s. Only the last one was slower, and as you’ll see below, everyone slowed down in the last furlong of this race. That evenness is the main reason he won, and it’s the thread running through this whole series.
On Racing TV the sectional times are also colour-coded against RaceIQ’s own par for the course and distance, from Very Slow to Very Fast. Part 3 covers what that par means.
The shape of a race: early, middle and closing
To see how a race was run, rather than how one horse ran it, I split it into three parts. For a mile:- Early: furlongs 2 and 3, once the field is up and running and the order is settling.
- Middle: furlongs 4 to 6, where races are often steadied or quickened.
- Closing: the last two furlongs. This is the same section RaceIQ uses for its finishing speed figure in races up to a mile and 110 yards (for longer races it uses the last three).
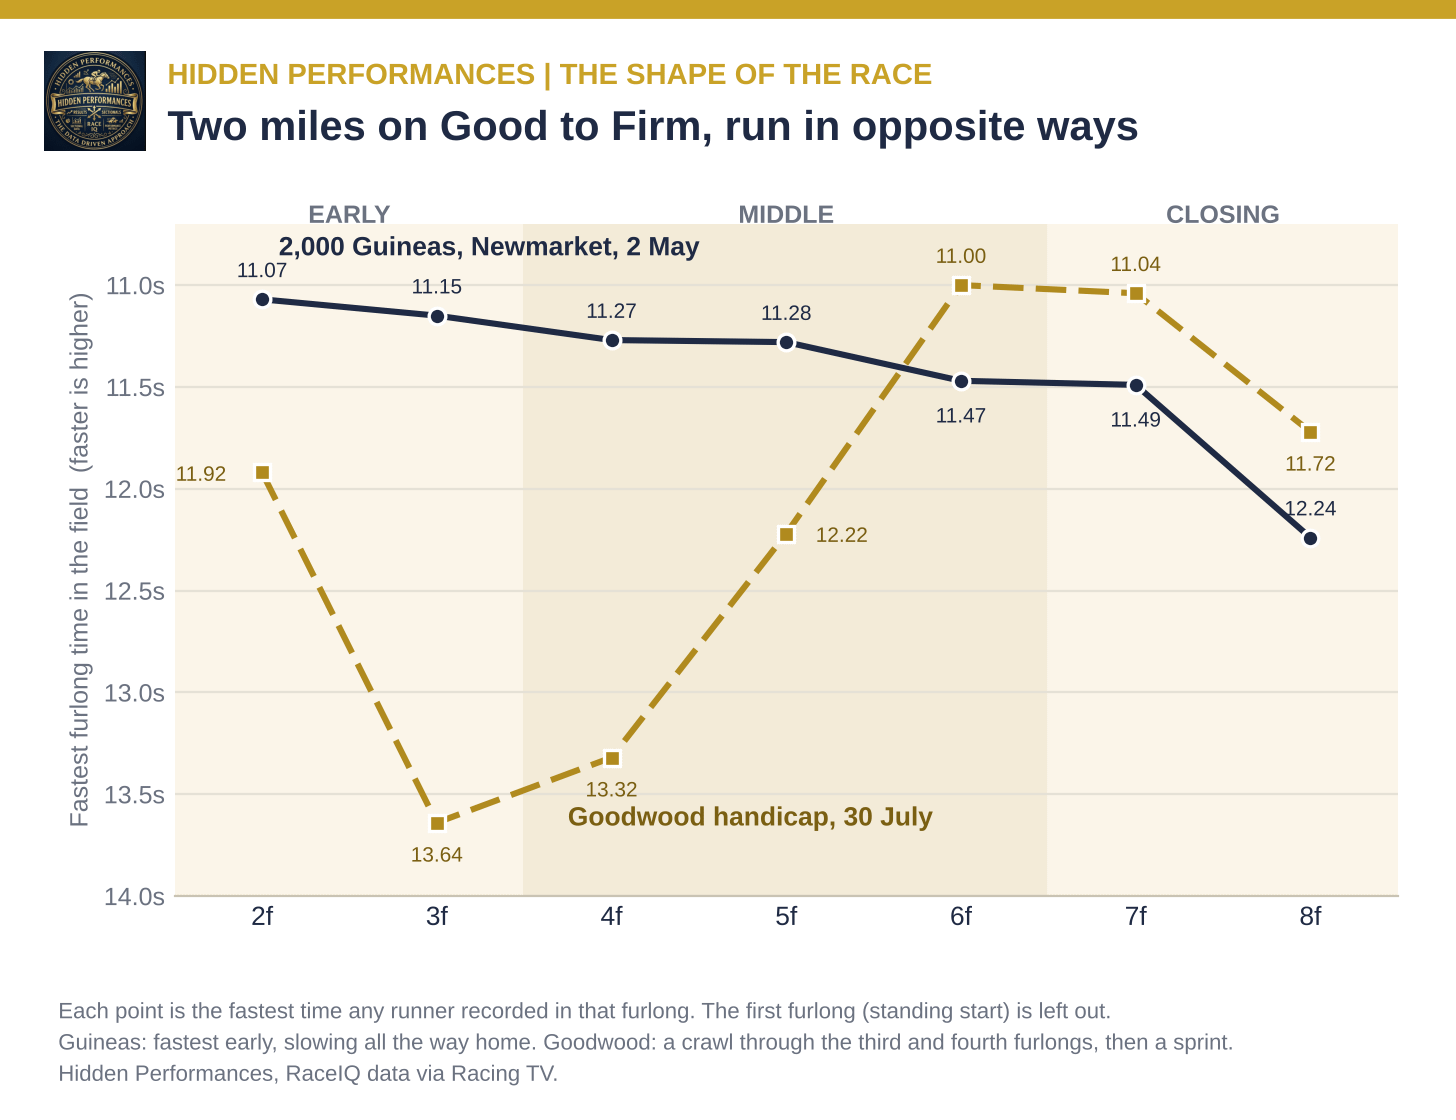
They’re close to mirror images. The Guineas was run flat out from the start and slowed down all the way home. At Goodwood the field went steadily for the third and fourth furlongs, two to two and a half seconds a furlong slower than the Guineas over the same stretch, and then sprinted. The fastest furlongs of the Guineas came in the early part. The fastest furlongs at Goodwood came two furlongs from home.
The shape of a race decides who can win it. When the early pace is strong, the horses near the front spend energy they’ll need later, and the race tends to set up for those who sit off it. When the early pace is slow, nobody gets tired, the race becomes a sprint, and being near the front when it starts is a big advantage. The same horse can run very differently in those two races without being any better or worse.
https://substackcdn.com/image/fetch...fef8-e2bb-46b4-9cb1-9ecae304e534_1456x432.png
Worked example 1: the 2,000 Guineas (fast early)
Fourteen ran. The fastest second furlong anyone ran was 11.07s, by Billecart, and the fastest third furlong 11.15s. Those are quick times for the early stages of a mile, and the race never got faster after that. Taking the fastest time in each furlong, the early section averaged 11.11s, the middle 11.34s and the closing section 11.87s. Each part of the race was slower than the part before it.That tells you the leaders were using energy at a rate they couldn’t keep up. The table shows where six of the runners were and how fast they were going in each part of the race.
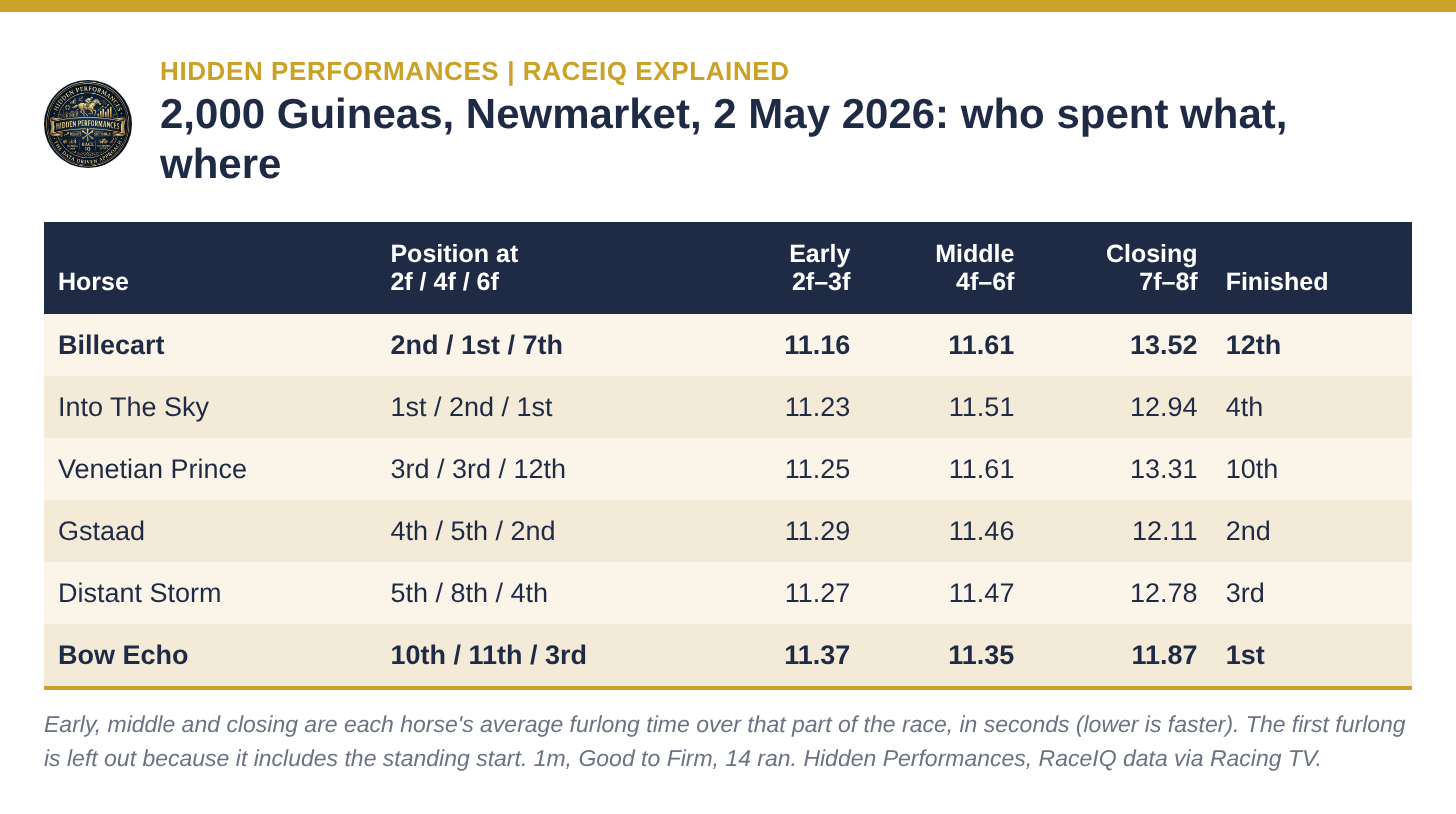
Billecart was second after two furlongs and in front at halfway. His early furlongs averaged 11.16s, the fastest of these six. By the sixth furlong he was 7th, and his last two furlongs took 12.76s and 14.28s. He finished 12th, beaten 20¼ lengths. He ran the final furlong 2.04s slower than Bow Echo, around a dozen lengths lost in a single furlong. The energy he spent early ran out.
Venetian Prince, 3rd at halfway, ran almost the same race: quick early, gone by the sixth furlong, 10th at the line.
Into The Sky is the interesting one. He was in front after one furlong, second at halfway and in front again at six furlongs, so he did as much work early as anything. He still finished 4th, beaten 12 lengths. Still finishing 4th after leading in a race run this fast is a better run than the bare result suggests: the three horses ahead of him all sat further back early. Part 5 covers how I put a figure on that.
Bow Echo did the opposite. He was 10th after two furlongs and 11th at halfway, and he was the slowest of these six early (11.37s). But his times hardly changed: 11.35s through the middle and 11.87s at the finish, the fastest closing section in the race. He ran the fastest time of anyone in each of the last three furlongs and won by 2¾ lengths. He didn’t speed up. He kept going at the same speed while the horses in front slowed down.
Gstaad, 2nd, ran the next most even race. He was 4th or 5th early, closer to the pace than Bow Echo and a little quicker through the early furlongs, and he paid for it slightly at the end: his last two furlongs took 0.49s longer than Bow Echo’s.
One way to see this in a single number is the gap between a horse’s fastest and slowest furlong after the start. For Bow Echo it was 0.96s. For Billecart it was 3.21s. The horse that spread his effort most evenly won, and the horse that front-loaded it finished 12th.
Worked example 2: Goodwood, 30 July (slow early)
The HKJC World Pool Handicap, a mile for 3-year-olds, 19 ran. The field went quickly enough in the second furlong (11.92s at best) as they sorted out positions, and then almost stopped. The fastest third furlong anyone ran was 13.64s, about 33mph, against 11.15s and more than 40mph over the same furlong of the Guineas. The fourth was no quicker (13.32s at best).From there it was a sprint. The fastest sixth furlong was 11.00s and the fastest seventh 11.04s, faster than anything in the Guineas. The early section averaged 12.78s, the middle 12.18s and the closing section 11.38s, the reverse of the Guineas.
Goodwood’s mile normally finishes faster than it starts, so some of this shape is the track. Even allowing for that, this race was a long way outside normal, and my calculator, which adjusts for each course and trip, puts it in the Slow band. The Guineas comes out Very Fast. Part 2 explains how those bands are worked out.
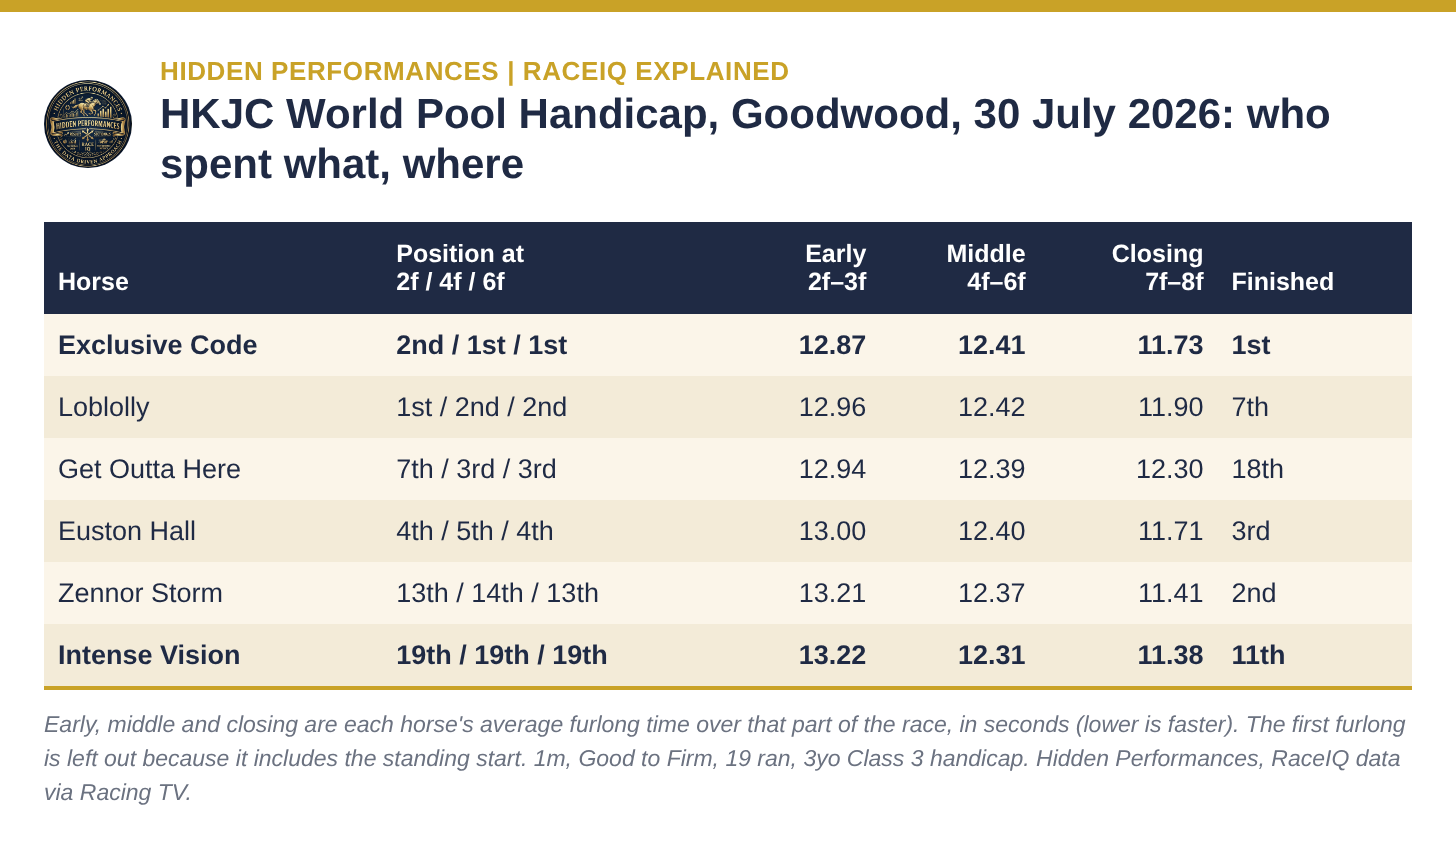
Exclusive Code, the 2/1 favourite, led after a furlong and set the steady pace himself. His third and fourth furlongs took 13.64s and 13.57s. He then quickened to 11.22s twice and was never caught, winning by a length. When the sprint came he was already in front and had used less energy than anything in the race. On RaceIQ’s finishing speed figure he ranks only 13th of 19, because in a race like this almost every horse finishes fast. That is the clearest sign of a slowly run race, and it is why Part 3 matters.
Intense Vision was 19th of 19 at two, four and six furlongs, 1.42s (eight or nine lengths) behind at halfway. He then ran the fastest seventh furlong (11.04s) and the joint-fastest final furlong (11.72s) of anyone and had the best finishing speed in the race. He finished 11th, beaten 4 lengths. Those figures look striking, but they were easy to produce. He was at the back while the leader went at 33mph, saved all his energy, and had too much ground to make up once the race began.
Zennor Storm, 2nd at 18/1, was the best of the closers. He was 14th at halfway and ran 11.10s and 11.72s at the finish, nearly as fast as Intense Vision but from a little closer, which was the difference between 2nd and 11th.
Get Outta Here was 3rd at halfway and at six furlongs, then dropped away to finish 18th. In a race this slow, a horse close to the pace that drops out like that has run poorly. Unlike the Guineas leaders, he wasn’t asked to do too much early.
One more figure to file away for Part 4: Exclusive Code also had the longest average stride in the race (7.35 metres). Part 4 looks at what stride length and stride rate tell you about how efficiently a horse is travelling.
The two races side by side
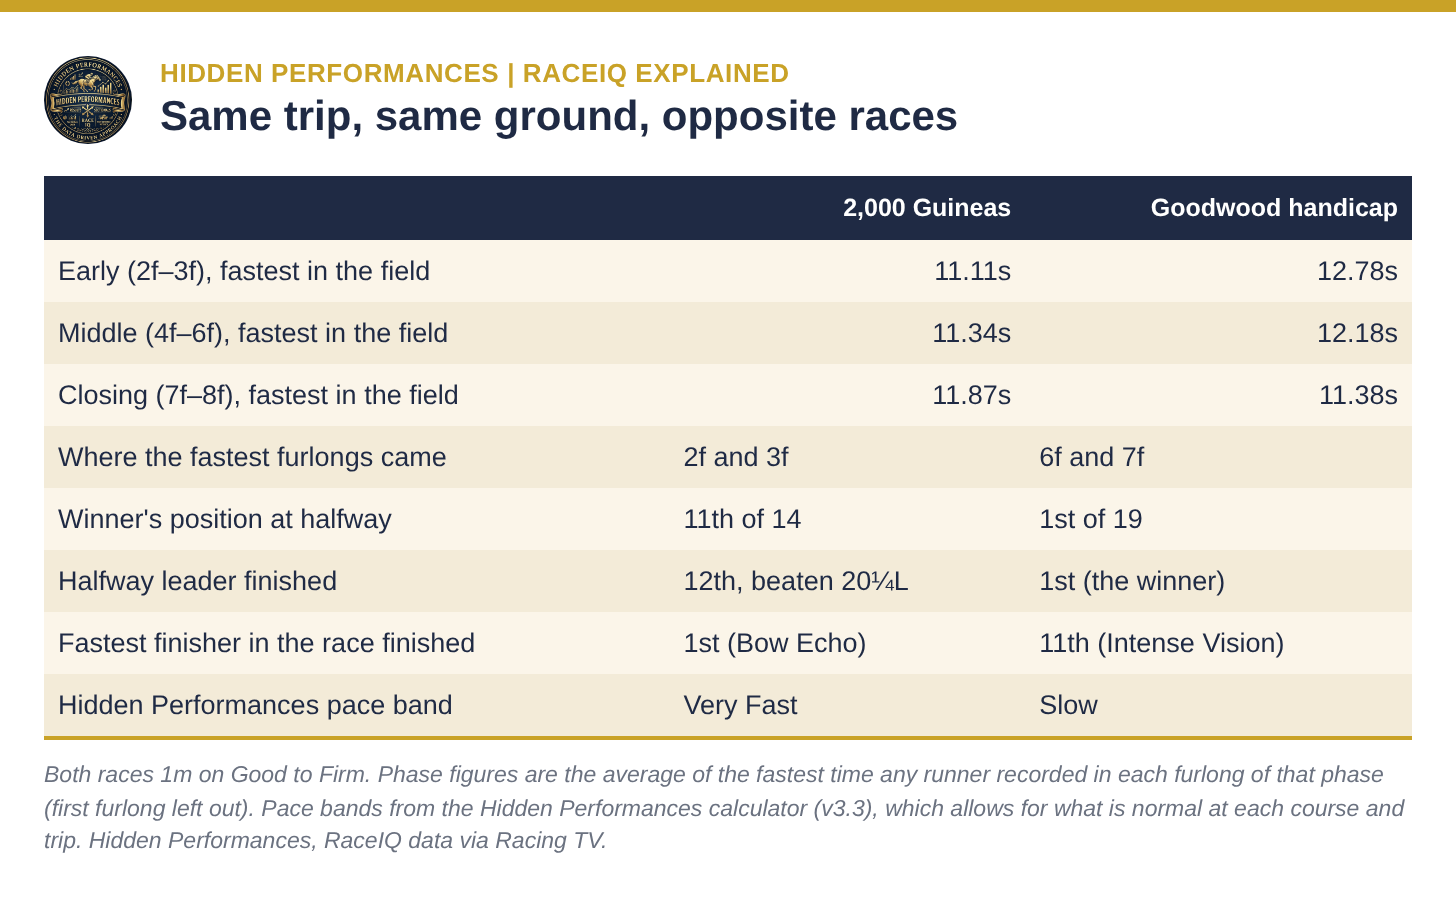
Put the two shapes together and the rules of thumb follow:
- In a race that is fast early, the horses near the front pay for it. A horse that raced prominently and still finished close has run better than its position. A horse that came from behind deserves its win, but the race was set up for it, and you should be wary of rating every closer highly.
- In a race that is slow early, being close to the pace when the race quickens is the advantage. A horse that came from the back to finish fast has not necessarily run well, because everyone finishes fast in a slow race. A horse that raced prominently and dropped away has usually run poorly, because the race didn’t tire it.
- In both, look at how evenly a horse spread its effort. The more even its furlong times, the less energy it wasted.
Try it yourself: reading the shape of any race
- Open the result on racingtv.com and click the Sectionals tab.
- For each furlong after the first, find the fastest time any horse ran. (Racing TV’s pace graph under each horse plots these, so you can read the shape off it too.)
- Split the race into early, middle and closing, and see where the fastest and slowest furlongs came.
- Find where the winner was at halfway and where the horses in front of it then finished.
- For any horse you’re interested in, look at how much its own furlong times varied after the start, and where it was when the race was at its fastest.
Your homework horse
Oxagon finished 6th in the Guineas at 12/1, beaten 12¾ lengths. He was 13th after a furlong, 14th (last) after three, 12th at halfway, 9th at six furlongs and 8th entering the final furlong. His furlong times from the second to the fifth were 11.41s, 11.25s, 11.32s and 11.28s, then 11.62s, 12.17s and 13.47s. He had the third-best finishing speed in the race.Did Oxagon run better than 6th? Think about the shape of the race, which horses he was passing in the last three furlongs, and how his closing times compare with Bow Echo’s. My answer is in Part 2.
The terms used in this post
- Furlong: 220 yards, an eighth of a mile. RaceIQ times every horse through every furlong.
- Sectional time (split): the time a horse took to run one furlong. Lower is faster.
- Time behind the leader: how far behind the leader a horse was at the end of a furlong, in seconds. Roughly six lengths to the second at racing speed.
- Early, middle and closing: my three parts of a race. For a mile: furlongs 2–3, 4–6 and 7–8. The first furlong is left out because of the standing start.
- Fastest split: the fastest time any horse ran in a given furlong. Read across the race, it shows how fast the race was being run at each stage.
- Finishing speed (FSP%): how fast a horse ran the closing furlongs compared with its average through the whole race. Above 100% it quickened, below 100% it slowed. Covered in Part 3.
- Pace band: my rating of how a race was run, from Slow to Very Fast, allowing for what is normal at the course and trip. Covered in Part 2.
Reading the shape of the race before judging any horse in it is the starting point of the method in Hidden Performance: Reading the Race the Form Book Doesn’t Show You.
Data: RaceIQ sectionals via Racing TV (sectional times, positions, time behind the leader, finishing speed and stride length). RaceIQ background from Racing TV and Racecourse Media Group. Phase averages and pace bands are my own calculations (Hidden Performances calculator, framework v3.3). Starting prices and beaten distances from the official results.