• Hi Guest Just in case you were not aware I wanted to highlight that you can now get a free 7 day trial of Horseracebase here.
    We have a lot of members who are existing users of Horseracebase so help is always available if needed, as well as dedicated section of the fourm here.
    Best Wishes
    AR

Apprentice weight in Hcap

It would be more useful to know the horses optimal racing weight.

From an old post that I made on the Forum

“Roger Charlton to be one of the good guys and he was the one who said that one of his runners was carrying too much body weight in a previous race and in the race about to be run was back to his racing weight, the horse won.
My Comments about this horse
He said that Al Kazeem weighed 515 Kilo's ar Newbury LTO, Weighs 507 Kilos tonight and was racing off 497 last year. He said he had been trying to get the weight off the horse but that he is a bit more lazy since coming back into training.”


Until the BHA organises weighing scales as being mandatory and horses weighed before racing. We will always be in the dark
 
Sorry will do this morning Simon

Flat Handicap Weight Rank – Win A/E, Place A/E, Going and Distance​

I have gone back through some historical Flat handicap work to look at weight rank in a bit more depth.

The analysis covers 81,604 Flat/AW handicaps and 805,452 runners. After removing nine races containing invalid SP values, the main win analysis contains 81,595 races and 805,360 runners. For the place analysis there were 79,415 valid races and 797,066 runners. Pasted text

The idea was not simply to look at raw strike rate. For every race I converted SP into implied probability and then normalised the probabilities so that the race summed to 100%. This gives a market-derived expected win rate and therefore an Actual/Expected (A/E) figure.

I have also now added expected place probabilities. As there are no historical place prices in this database, these were derived from the normalised win probabilities using a Harville/Plackett-Luce model. The actual Place field in the database determines whether a horse placed. So the place A/E is:

Actual places ÷ expected places

The place probability calculations balanced correctly at race level, with effectively zero probability-sum error. Pasted text

Weight rank overall​

The first thing that stands out is how orderly the basic weight-rank relationship is.

On Turf, top weights won 14.40% of their races, second weights 12.95%, third weights 11.86%, fourth weights 10.78%, and the strike rate continued falling as we moved down the weights.

However, after allowing for the market expectation, the Win A/E figures are remarkably close to 1.00:

Weight RankWin %Expected Win %Win A/EPlace A/E
114.4014.221.010.98
212.9512.861.010.99
311.8611.851.000.98
410.7810.761.001.01
59.569.581.001.01
68.468.461.001.01
77.347.341.001.02
86.306.450.981.02
95.585.720.971.04
10+4.654.641.001.03
So the simple conclusion remains that higher-weighted horses are stronger horses, but the win market knows that very well. Pasted text

One interesting wrinkle is that the top weight's Place A/E is only 0.98, despite its Win A/E being 1.01. That suggests the top weight is not generally over-performing throughout the finishing positions to the same extent as its raw win strike rate might imply.

Going makes a much bigger difference​

This was where the analysis became more interesting.

For top weights on Turf:

GoingWin %Exp Win %Win A/EPlace %Exp Place %Place A/E
Firm/GF16.3615.831.0337.0637.021.00
Good13.6213.451.0133.7834.210.99
Good/Soft13.2313.181.0032.4833.730.96
Soft/Heavy13.0613.480.9731.2133.830.92
Pasted text

The place figures strengthen the soft-ground finding.

On Firm/Good to Firm, top weights place almost exactly as often as the SP model expects: Place A/E 1.00.

On Soft/Heavy, they not only win less often than expected — Win A/E 0.97 — but their Place A/E falls to 0.92.

That is important because it suggests this is not merely a question of top weights failing to turn a good run into a win. On testing ground they are, historically, also finishing in the places less often than the SP market would expect.

Distance and going together​

Distance by itself did not produce a simple pattern. The more revealing results came when distance and going were combined.

The most interesting cells were:

Distance / GoingWin A/EPlace A/E
5f Firm/GF1.011.00
5f Soft/Heavy1.100.95
6f Firm/GF1.061.00
6f Soft/Heavy0.990.90
7f Firm/GF1.091.04
7f Soft/Heavy0.930.91
1m Firm/GF1.001.00
1m Soft/Heavy0.870.92
9–10f Firm/GF1.041.00
9–10f Soft/Heavy0.930.90
11–12f Good1.111.00
15f+ Soft/Heavy0.880.94
Pasted text

For me, 1m on Soft/Heavy is probably the clearest negative result so far.

There were 1,717 runners, with a Win A/E of 0.87. More importantly, the Place A/E was also only 0.92.

So this is not simply a case of top weights reaching the frame but failing to win. They were under-performing the SP-derived expectation on both measures. Pasted text

The same general pattern is present at 7f Soft/Heavy:

Win A/E 0.93
Place A/E 0.91


and at 9–10f Soft/Heavy:

Win A/E 0.93
Place A/E 0.90
. Pasted text

That makes the middle-distance/testing-ground area particularly interesting.

7f on faster ground is almost the opposite​

One of the strongest positive combinations is 7f Firm/Good to Firm.

There were 3,128 top weights, of which 509 won:

Actual Win % 16.27
Expected Win % 14.98
Win A/E 1.09


The place figures were also positive:

Actual Place % 38.36
Expected Place % 36.74
Place A/E 1.04


Both the win and place measures are therefore pointing in the same direction. Pasted text

That is more persuasive to me than something such as 11–12f on Good, where the Win A/E is an impressive 1.11 but the Place A/E is exactly 1.00. In the latter case it may be more about converting competitive runs into wins than a broad performance advantage. Pasted text

A useful warning from 5f Soft/Heavy​

The 5f result is also a good warning against making the theory too simplistic.

At 5f on Soft/Heavy:

Win A/E = 1.10
Place A/E = 0.95


So top weights actually won more often than their market expectation, despite placing slightly less often than expected. Pasted text

That alone tells me that a rule such as:

“big weights struggle on soft ground”

is too crude.

The interaction between distance and going matters.

Recent results​

There is also no evidence that the general Turf top-weight win relationship has disappeared recently.

For Turf top weights:

Last 90 days: Win A/E 0.99, Place A/E 1.00
Last 180 days: Win A/E 1.02, Place A/E 0.99
Last 365 days: Win A/E 1.02, Place A/E 0.97
Last 730 days: Win A/E 1.02, Place A/E 0.98
All history: Win A/E 1.01, Place A/E 0.98

Pasted text

So overall it remains a very efficiently priced part of the market.

What I take from it​

My conclusion at this stage is that weight rank by itself is not particularly useful as a betting angle.

There is a strong and very orderly relationship between weight rank and strike rate, but SP largely prices that relationship correctly.

What looks more interesting is the interaction between:

Weight Rank × Going × Distance

and possibly eventually:

Weight Rank × Going × Distance × Field Size × Horse Type/Size

The addition of Place A/E has made some of these results more convincing.

In particular, 7f–10f on Soft/Heavy ground appears worth further investigation because top weights are under-performing market expectation in both wins and places.

Conversely, 7f Firm/Good to Firm currently shows the opposite pattern, with both Win A/E and Place A/E above expectation.

This also makes the suggestion about using historical stride length as a pre-race proxy for horse size/frame particularly interesting. Actual historical horse-height data is difficult to obtain, whereas average stride length from previous sectional runs may give us something measurable to test.

I don't think the evidence says simply that “high weights are good” or “high weights are bad”.
 

Flat Handicap Weight Rank – Win A/E, Place A/E, Going and Distance​

I have gone back through some historical Flat handicap work to look at weight rank in a bit more depth.

The analysis covers 81,604 Flat/AW handicaps and 805,452 runners. After removing nine races containing invalid SP values, the main win analysis contains 81,595 races and 805,360 runners. For the place analysis there were 79,415 valid races and 797,066 runners. Pasted text

The idea was not simply to look at raw strike rate. For every race I converted SP into implied probability and then normalised the probabilities so that the race summed to 100%. This gives a market-derived expected win rate and therefore an Actual/Expected (A/E) figure.

I have also now added expected place probabilities. As there are no historical place prices in this database, these were derived from the normalised win probabilities using a Harville/Plackett-Luce model. The actual Place field in the database determines whether a horse placed. So the place A/E is:

Actual places ÷ expected places

The place probability calculations balanced correctly at race level, with effectively zero probability-sum error. Pasted text

Weight rank overall​

The first thing that stands out is how orderly the basic weight-rank relationship is.

On Turf, top weights won 14.40% of their races, second weights 12.95%, third weights 11.86%, fourth weights 10.78%, and the strike rate continued falling as we moved down the weights.

However, after allowing for the market expectation, the Win A/E figures are remarkably close to 1.00:

Weight RankWin %Expected Win %Win A/EPlace A/E
114.4014.221.010.98
212.9512.861.010.99
311.8611.851.000.98
410.7810.761.001.01
59.569.581.001.01
68.468.461.001.01
77.347.341.001.02
86.306.450.981.02
95.585.720.971.04
10+4.654.641.001.03
So the simple conclusion remains that higher-weighted horses are stronger horses, but the win market knows that very well. Pasted text

One interesting wrinkle is that the top weight's Place A/E is only 0.98, despite its Win A/E being 1.01. That suggests the top weight is not generally over-performing throughout the finishing positions to the same extent as its raw win strike rate might imply.

Going makes a much bigger difference​

This was where the analysis became more interesting.

For top weights on Turf:

GoingWin %Exp Win %Win A/EPlace %Exp Place %Place A/E
Firm/GF16.3615.831.0337.0637.021.00
Good13.6213.451.0133.7834.210.99
Good/Soft13.2313.181.0032.4833.730.96
Soft/Heavy13.0613.480.9731.2133.830.92
Pasted text

The place figures strengthen the soft-ground finding.

On Firm/Good to Firm, top weights place almost exactly as often as the SP model expects: Place A/E 1.00.

On Soft/Heavy, they not only win less often than expected — Win A/E 0.97 — but their Place A/E falls to 0.92.

That is important because it suggests this is not merely a question of top weights failing to turn a good run into a win. On testing ground they are, historically, also finishing in the places less often than the SP market would expect.

Distance and going together​

Distance by itself did not produce a simple pattern. The more revealing results came when distance and going were combined.

The most interesting cells were:

Distance / GoingWin A/EPlace A/E
5f Firm/GF1.011.00
5f Soft/Heavy1.100.95
6f Firm/GF1.061.00
6f Soft/Heavy0.990.90
7f Firm/GF1.091.04
7f Soft/Heavy0.930.91
1m Firm/GF1.001.00
1m Soft/Heavy0.870.92
9–10f Firm/GF1.041.00
9–10f Soft/Heavy0.930.90
11–12f Good1.111.00
15f+ Soft/Heavy0.880.94
Pasted text

For me, 1m on Soft/Heavy is probably the clearest negative result so far.

There were 1,717 runners, with a Win A/E of 0.87. More importantly, the Place A/E was also only 0.92.

So this is not simply a case of top weights reaching the frame but failing to win. They were under-performing the SP-derived expectation on both measures. Pasted text

The same general pattern is present at 7f Soft/Heavy:

Win A/E 0.93
Place A/E 0.91


and at 9–10f Soft/Heavy:

Win A/E 0.93
Place A/E 0.90
. Pasted text

That makes the middle-distance/testing-ground area particularly interesting.

7f on faster ground is almost the opposite​

One of the strongest positive combinations is 7f Firm/Good to Firm.

There were 3,128 top weights, of which 509 won:

Actual Win % 16.27
Expected Win % 14.98
Win A/E 1.09


The place figures were also positive:

Actual Place % 38.36
Expected Place % 36.74
Place A/E 1.04


Both the win and place measures are therefore pointing in the same direction. Pasted text

That is more persuasive to me than something such as 11–12f on Good, where the Win A/E is an impressive 1.11 but the Place A/E is exactly 1.00. In the latter case it may be more about converting competitive runs into wins than a broad performance advantage. Pasted text

A useful warning from 5f Soft/Heavy​

The 5f result is also a good warning against making the theory too simplistic.

At 5f on Soft/Heavy:

Win A/E = 1.10
Place A/E = 0.95


So top weights actually won more often than their market expectation, despite placing slightly less often than expected. Pasted text

That alone tells me that a rule such as:

“big weights struggle on soft ground”

is too crude.

The interaction between distance and going matters.

Recent results​

There is also no evidence that the general Turf top-weight win relationship has disappeared recently.

For Turf top weights:

Last 90 days: Win A/E 0.99, Place A/E 1.00
Last 180 days: Win A/E 1.02, Place A/E 0.99
Last 365 days: Win A/E 1.02, Place A/E 0.97
Last 730 days: Win A/E 1.02, Place A/E 0.98
All history: Win A/E 1.01, Place A/E 0.98

Pasted text

So overall it remains a very efficiently priced part of the market.

What I take from it​

My conclusion at this stage is that weight rank by itself is not particularly useful as a betting angle.

There is a strong and very orderly relationship between weight rank and strike rate, but SP largely prices that relationship correctly.

What looks more interesting is the interaction between:

Weight Rank × Going × Distance

and possibly eventually:

Weight Rank × Going × Distance × Field Size × Horse Type/Size

The addition of Place A/E has made some of these results more convincing.

In particular, 7f–10f on Soft/Heavy ground appears worth further investigation because top weights are under-performing market expectation in both wins and places.

Conversely, 7f Firm/Good to Firm currently shows the opposite pattern, with both Win A/E and Place A/E above expectation.

This also makes the suggestion about using historical stride length as a pre-race proxy for horse size/frame particularly interesting. Actual historical horse-height data is difficult to obtain, whereas average stride length from previous sectional runs may give us something measurable to test.

I don't think the evidence says simply that “high weights are good” or “high weights are bad”.
You might find Tapeta interesting
 

Flat Handicap Weight Rank – Win A/E, Place A/E, Going and Distance​

I have gone back through some historical Flat handicap work to look at weight rank in a bit more depth.

The analysis covers 81,604 Flat/AW handicaps and 805,452 runners. After removing nine races containing invalid SP values, the main win analysis contains 81,595 races and 805,360 runners. For the place analysis there were 79,415 valid races and 797,066 runners. Pasted text

The idea was not simply to look at raw strike rate. For every race I converted SP into implied probability and then normalised the probabilities so that the race summed to 100%. This gives a market-derived expected win rate and therefore an Actual/Expected (A/E) figure.

I have also now added expected place probabilities. As there are no historical place prices in this database, these were derived from the normalised win probabilities using a Harville/Plackett-Luce model. The actual Place field in the database determines whether a horse placed. So the place A/E is:

Actual places ÷ expected places

The place probability calculations balanced correctly at race level, with effectively zero probability-sum error. Pasted text

Weight rank overall​

The first thing that stands out is how orderly the basic weight-rank relationship is.

On Turf, top weights won 14.40% of their races, second weights 12.95%, third weights 11.86%, fourth weights 10.78%, and the strike rate continued falling as we moved down the weights.

However, after allowing for the market expectation, the Win A/E figures are remarkably close to 1.00:

Weight RankWin %Expected Win %Win A/EPlace A/E
114.4014.221.010.98
212.9512.861.010.99
311.8611.851.000.98
410.7810.761.001.01
59.569.581.001.01
68.468.461.001.01
77.347.341.001.02
86.306.450.981.02
95.585.720.971.04
10+4.654.641.001.03
So the simple conclusion remains that higher-weighted horses are stronger horses, but the win market knows that very well. Pasted text

One interesting wrinkle is that the top weight's Place A/E is only 0.98, despite its Win A/E being 1.01. That suggests the top weight is not generally over-performing throughout the finishing positions to the same extent as its raw win strike rate might imply.

Going makes a much bigger difference​

This was where the analysis became more interesting.

For top weights on Turf:

GoingWin %Exp Win %Win A/EPlace %Exp Place %Place A/E
Firm/GF16.3615.831.0337.0637.021.00
Good13.6213.451.0133.7834.210.99
Good/Soft13.2313.181.0032.4833.730.96
Soft/Heavy13.0613.480.9731.2133.830.92
Pasted text

The place figures strengthen the soft-ground finding.

On Firm/Good to Firm, top weights place almost exactly as often as the SP model expects: Place A/E 1.00.

On Soft/Heavy, they not only win less often than expected — Win A/E 0.97 — but their Place A/E falls to 0.92.

That is important because it suggests this is not merely a question of top weights failing to turn a good run into a win. On testing ground they are, historically, also finishing in the places less often than the SP market would expect.

Distance and going together​

Distance by itself did not produce a simple pattern. The more revealing results came when distance and going were combined.

The most interesting cells were:

Distance / GoingWin A/EPlace A/E
5f Firm/GF1.011.00
5f Soft/Heavy1.100.95
6f Firm/GF1.061.00
6f Soft/Heavy0.990.90
7f Firm/GF1.091.04
7f Soft/Heavy0.930.91
1m Firm/GF1.001.00
1m Soft/Heavy0.870.92
9–10f Firm/GF1.041.00
9–10f Soft/Heavy0.930.90
11–12f Good1.111.00
15f+ Soft/Heavy0.880.94
Pasted text

For me, 1m on Soft/Heavy is probably the clearest negative result so far.

There were 1,717 runners, with a Win A/E of 0.87. More importantly, the Place A/E was also only 0.92.

So this is not simply a case of top weights reaching the frame but failing to win. They were under-performing the SP-derived expectation on both measures. Pasted text

The same general pattern is present at 7f Soft/Heavy:

Win A/E 0.93
Place A/E 0.91


and at 9–10f Soft/Heavy:

Win A/E 0.93
Place A/E 0.90
. Pasted text

That makes the middle-distance/testing-ground area particularly interesting.

7f on faster ground is almost the opposite​

One of the strongest positive combinations is 7f Firm/Good to Firm.

There were 3,128 top weights, of which 509 won:

Actual Win % 16.27
Expected Win % 14.98
Win A/E 1.09


The place figures were also positive:

Actual Place % 38.36
Expected Place % 36.74
Place A/E 1.04


Both the win and place measures are therefore pointing in the same direction. Pasted text

That is more persuasive to me than something such as 11–12f on Good, where the Win A/E is an impressive 1.11 but the Place A/E is exactly 1.00. In the latter case it may be more about converting competitive runs into wins than a broad performance advantage. Pasted text

A useful warning from 5f Soft/Heavy​

The 5f result is also a good warning against making the theory too simplistic.

At 5f on Soft/Heavy:

Win A/E = 1.10
Place A/E = 0.95


So top weights actually won more often than their market expectation, despite placing slightly less often than expected. Pasted text

That alone tells me that a rule such as:

“big weights struggle on soft ground”

is too crude.

The interaction between distance and going matters.

Recent results​

There is also no evidence that the general Turf top-weight win relationship has disappeared recently.

For Turf top weights:

Last 90 days: Win A/E 0.99, Place A/E 1.00
Last 180 days: Win A/E 1.02, Place A/E 0.99
Last 365 days: Win A/E 1.02, Place A/E 0.97
Last 730 days: Win A/E 1.02, Place A/E 0.98
All history: Win A/E 1.01, Place A/E 0.98

Pasted text

So overall it remains a very efficiently priced part of the market.

What I take from it​

My conclusion at this stage is that weight rank by itself is not particularly useful as a betting angle.

There is a strong and very orderly relationship between weight rank and strike rate, but SP largely prices that relationship correctly.

What looks more interesting is the interaction between:

Weight Rank × Going × Distance

and possibly eventually:

Weight Rank × Going × Distance × Field Size × Horse Type/Size

The addition of Place A/E has made some of these results more convincing.

In particular, 7f–10f on Soft/Heavy ground appears worth further investigation because top weights are under-performing market expectation in both wins and places.

Conversely, 7f Firm/Good to Firm currently shows the opposite pattern, with both Win A/E and Place A/E above expectation.

This also makes the suggestion about using historical stride length as a pre-race proxy for horse size/frame particularly interesting. Actual historical horse-height data is difficult to obtain, whereas average stride length from previous sectional runs may give us something measurable to test.

I don't think the evidence says simply that “high weights are good” or “high weights are bad”.
T tony spencer
Is it just "straight" Harville your using Tony to calculate Place Probabilities ? - If so then there are tons of academic theory to suggest that Harville's original formula contained simple basic flaws. Basically the suggested coefficients lead to pricing biases within the 2nd, 3rd & 4th places due to the assumption that horse racing placings follow a strict exponential distribution. A study of finishing times show that this is not the case and a correction is usually required which has come to be known as "Discounted Harville" - the work of Victor Lo & John Bacon Shone who at one time worked with the Woods/Libertine Investments Syndicate in Hong Kong is probably still relevant to this day and the majority of it along with some contributions by Bill Ziemba, Henery & Stern appear in this weighty tomb which has been a bit of a "bible" for horse racing modellers over the years.
https://www.dropbox.com/scl/fi/slhj51hh8k548ql59vppp/Efficiency-Of-Racetrack-Betting-Markets.pdf?
rlkey=3mcq48m82ctsc4v3i6is8gxuz&st=puxlb1rm&dl=0
Your welcome to download a copy.

If your struggling with the math then my old friend John Dineen has a blog and he posted up a Discounted Harville spreadsheet with the recommended alternative coefficients
Discounted Harville v1.17 (VBA Functions - Excel 2007+)
Example Spreadsheet is here
https://onedrive.live.com/:x:/g/per...lFVmdwVzhnZVFySDZnUEhxblVzUGlfWnc_ZT0zdnhhV1c
 
Just gwtting 5 min Mark been working on a really detailed Trainer Behaviour model which looks extremely promising for the past 3 months
In MySportsAI you can slice the data on trainer and examine trainer profiles although I am sure how effective models would be due to the sample sizes and data/behaviour drift. Here is an interesting comparison of how T D Easterbys horses fare when they drift compared to Fahey's. The plot confirms that Fahey is a gambling yard

test.png
 
T tony spencer
Is it just "straight" Harville your using Tony to calculate Place Probabilities ? - If so then there are tons of academic theory to suggest that Harville's original formula contained simple basic flaws. Basically the suggested coefficients lead to pricing biases within the 2nd, 3rd & 4th places due to the assumption that horse racing placings follow a strict exponential distribution. A study of finishing times show that this is not the case and a correction is usually required which has come to be known as "Discounted Harville" - the work of Victor Lo & John Bacon Shone who at one time worked with the Woods/Libertine Investments Syndicate in Hong Kong is probably still relevant to this day and the majority of it along with some contributions by Bill Ziemba, Henery & Stern appear in this weighty tomb which has been a bit of a "bible" for horse racing modellers over the years.
https://www.dropbox.com/scl/fi/slhj51hh8k548ql59vppp/Efficiency-Of-Racetrack-Betting-Markets.pdf?
rlkey=3mcq48m82ctsc4v3i6is8gxuz&st=puxlb1rm&dl=0
Your welcome to download a copy.

If your struggling with the math then my old friend John Dineen has a blog and he posted up a Discounted Harville spreadsheet with the recommended alternative coefficients
Discounted Harville v1.17 (VBA Functions - Excel 2007+)
Example Spreadsheet is here
https://onedrive.live.com/:x:/g/per...lFVmdwVzhnZVFySDZnUEhxblVzUGlfWnc_ZT0zdnhhV1c
Great i will have a look thank you
 
If v williams for years can buy small horses and run them on heavy ground over chases and long distance races with 12stone on back and do really well with them surely this proves one thing that height does not matter as long as you have the engine and heart in there and dayjur sprinter was not big but quick so i think its false to think bigger will do better .
 
If v williams for years can buy small horses and run them on heavy ground over chases and long distance races with 12stone on back and do really well with them surely this proves one thing that height does not matter as long as you have the engine and heart in there and dayjur sprinter was not big but quick so i think its false to think bigger will do better .
I am sorry Gerry it does not prove anything, its anecdotal and Dayjur was not a handicapper
 
Great i will have a look thank you
Mark, mine is going a fair bit deeper than a simple trainer split or one-dimensional angle, but I don’t really want to give away the exact construction at this stage.
The main thing I’ve been trying to avoid is exactly the problem you mention with small samples. A trainer can look brilliant or terrible in a very narrow situation simply because there are only a handful of runners, so I’m not treating raw strike rates in isolation as meaningful.
I’m looking at trainer behaviour across a number of different circumstances and trying to measure whether a pattern is repeatable, current and supported by enough evidence, rather than just something that happened historically. I’m also separating out situations where a trainer appears strong overall from situations where they are specifically strong or weak under certain race conditions.
The other important part is drift over time. A trainer pattern from several years ago may no longer be relevant, so recent behaviour has to be weighed against the longer-term evidence rather than just pooling everything together.
I’ve also found ranking useful. Rather than saying “Trainer X is good at this”, I’m trying to assess each trainer in the context of the actual race and compare the strength of the trainer profile against the other trainers represented.
So the aim isn’t really to find lots of little profitable trainer systems. It is to build a broader trainer-behaviour signal that can cope better with small samples, changing behaviour and conflicting evidence.
That is also why I’m quite interested in the market movement side. Once the trainer signal is produced independently, I can then look at whether certain trainers are subsequently backed or allowed to drift, and whether that market behaviour confirms or contradicts what the historical trainer profile was suggesting.
 
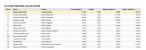
This is the night-before output, and the important point is that it isn’t simply trying to identify “good trainers” or “bad trainers”.

It is looking for trainer behaviour in the context of the race.

So in this Nottingham race, Joey Ramsden comes out Rank 1 with Pleasant Man at 11.19%, narrowly ahead of John & Rhys Flint on 11.05% and James Fanshawe on 10.64%.

That ranking is built from the trainer’s historical behaviour across a range of relevant circumstances, rather than one isolated statistic. The idea is to ask: given the type of horse, race and situation, which trainers have historically behaved most strongly in circumstances like these?

The percentage is then normalised within the race, so the field adds up to 100%. That lets me compare every trainer against the others in that particular race, rather than looking at them in isolation.

The Bet365 column is useful because it gives me a completely separate market view. For example, Pleasant Man was 17.00, which is an implied probability of only 5.88%, while the trainer model had him at 11.19%. So the trainer signal was materially stronger than the early market view.

What interests me next is what happens between the night-before price and race time. If a horse with a strong trainer-behaviour signal is then backed, that may be telling us something different from one that drifts badly.

So I’m not using this as a stand-alone betting system. The night-before model is effectively giving me a behavioural benchmark, and then I can watch how the market reacts to that benchmark the following day.

That is where I think it becomes especially interesting: trainer behaviour first, market behaviour second, with the two kept separate so I can see when they agree or disagree.
 
This is the night-before output, and the important point is that it isn’t simply trying to identify “good trainers” or “bad trainers”.

It is looking for trainer behaviour in the context of the race.

So in this Nottingham race, Joey Ramsden comes out Rank 1 with Pleasant Man at 11.19%, narrowly ahead of John & Rhys Flint on 11.05% and James Fanshawe on 10.64%.

That ranking is built from the trainer’s historical behaviour across a range of relevant circumstances, rather than one isolated statistic. The idea is to ask: given the type of horse, race and situation, which trainers have historically behaved most strongly in circumstances like these?

The percentage is then normalised within the race, so the field adds up to 100%. That lets me compare every trainer against the others in that particular race, rather than looking at them in isolation.

The Bet365 column is useful because it gives me a completely separate market view. For example, Pleasant Man was 17.00, which is an implied probability of only 5.88%, while the trainer model had him at 11.19%. So the trainer signal was materially stronger than the early market view.

What interests me next is what happens between the night-before price and race time. If a horse with a strong trainer-behaviour signal is then backed, that may be telling us something different from one that drifts badly.

So I’m not using this as a stand-alone betting system. The night-before model is effectively giving me a behavioural benchmark, and then I can watch how the market reacts to that benchmark the following day.

That is where I think it becomes especially interesting: trainer behaviour first, market behaviour second, with the two kept separate so I can see when they agree or disagree.
I like the idea of in race evaluation of trainer behaviour
 
This is the night-before output, and the important point is that it isn’t simply trying to identify “good trainers” or “bad trainers”.

It is looking for trainer behaviour in the context of the race.

So in this Nottingham race, Joey Ramsden comes out Rank 1 with Pleasant Man at 11.19%, narrowly ahead of John & Rhys Flint on 11.05% and James Fanshawe on 10.64%.

That ranking is built from the trainer’s historical behaviour across a range of relevant circumstances, rather than one isolated statistic. The idea is to ask: given the type of horse, race and situation, which trainers have historically behaved most strongly in circumstances like these?

The percentage is then normalised within the race, so the field adds up to 100%. That lets me compare every trainer against the others in that particular race, rather than looking at them in isolation.

The Bet365 column is useful because it gives me a completely separate market view. For example, Pleasant Man was 17.00, which is an implied probability of only 5.88%, while the trainer model had him at 11.19%. So the trainer signal was materially stronger than the early market view.

What interests me next is what happens between the night-before price and race time. If a horse with a strong trainer-behaviour signal is then backed, that may be telling us something different from one that drifts badly.

So I’m not using this as a stand-alone betting system. The night-before model is effectively giving me a behavioural benchmark, and then I can watch how the market reacts to that benchmark the following day.

That is where I think it becomes especially interesting: trainer behaviour first, market behaviour second, with the two kept separate so I can see when they agree or disagree.
Are you using KNN to evaluate the trainers
 
Back
Top