• The issue has been fixed and hopefully you can post screen shots again
  • Hi Guest Just in case you were not aware I wanted to highlight that you can now get a free 7 day trial of Horseracebase here.
    We have a lot of members who are existing users of Horseracebase so help is always available if needed, as well as dedicated section of the fourm here.
    Best Wishes
    AR

Horse Racing Data, Strategy, and AI Harnessing

View attachment 173197

A Ajit Whatever you already have will work.

Since we are on a horse racing forum, all data related to horse racing is fine.

On the screenshot, you can see a list of what I currently have, so it would be fine if you have something new, or if it's classic sources like Timeform or Racing Post that are now protected by Cloudflare Guard or Captcha, I simply haven't had time to reprogram for those yet.

My posts on this thread use three different data sources, but I would also like to extend my model using entirely new data.
I've sent you a message regarding timeform and racing post.

MY package is a private git repo. I don't mind select people tying in to it but I don't want to publish it on a free-to-view forum page obviously.
You will have to give me some time to map it to an api. I suppose ideally sending a pre-agreed json schema to the endpoint could resolve to the required output json but I don't have any thoughts at the moment as to what that might look like. Leave it with me.

It's php/python/javascript so json is the way to go if you're tied to F# or C# as seems to be the case.

edit: I haven't sent you a message in fact because I can't seem to work out how to do it.
 
1794142324549.png

Over the last few days, Dave Dave posted a series of posts about RaceIQ Explained, so I would like to show how I conduct initial research based on any post or idea found on the forum.

RaceIQ Explained, Part 1: Reading the Sectionals

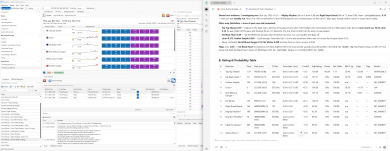
First, I ask the AI to summarize the main ideas and goals, integrating my available data that the agentic bfexplorer app can retrieve for an AI. The AI then generates a system prompt that I execute, and if the idea proves promising, I proceed with testing. If the strategy appears profitable, the second step is assisted coding of the exact strategy on my trading platform.

Above is a screenshot of this initial prompt execution.
 
Thanks, A Ajit; no problem—please take your time.

What I wanted to present was a way to show how different systems can be integrated into a single working workflow.

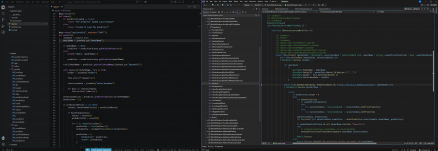
For instance, many of you use Machine Learning and Python packages, but for quick tasks, we also utilize AutoML. In these cases, the integration is achieved through an exposed REST API that runs the ML model in Python using Flask.

The attached screenshot shows both code samples: the ML API server and the F# strategy consuming the API.

1794143940648.png
 
After reading the ELO Ratings post, and since I lacked a complete database of race results, I created my own variation strategy called "Form Trajectory."

Since RaceIQ data are mentioned in many posts, I have found a source and plan to implement the necessary data parsing.

I currently have five different strategies, and for each one, there are two variations of model probability calculations—that means I need to test ten different sets of data. I still don't have an ideal way to test them; right now, I just switch from one strategy to another every day.

Therefore, I really need a strategy dashboard app at least to check the profit variances across those ten strategies.
 
After reading the ELO Ratings post, and since I lacked a complete database of race results, I created my own variation strategy called "Form Trajectory."

Since RaceIQ data are mentioned in many posts, I have found a source and plan to implement the necessary data parsing.

I currently have five different strategies, and for each one, there are two variations of model probability calculations—that means I need to test ten different sets of data. I still don't have an ideal way to test them; right now, I just switch from one strategy to another every day.

Therefore, I really need a strategy dashboard app at least to check the profit variances across those ten strategies.
Let me know if I can help with the results problem
 
I've sent you a message regarding timeform and racing post.

MY package is a private git repo. I don't mind select people tying in to it but I don't want to publish it on a free-to-view forum page obviously.
You will have to give me some time to map it to an api. I suppose ideally sending a pre-agreed json schema to the endpoint could resolve to the required output json but I don't have any thoughts at the moment as to what that might look like. Leave it with me.

It's php/python/javascript so json is the way to go if you're tied to F# or C# as seems to be the case.

edit: I haven't sent you a message in fact because I can't seem to work out how to do it.
As a new member you cannot send messages to other members.
 
Here is a description of the fields in the data

If you are interested in how the various ML alogorithms work then Josh
Starmer has produced some excellent videos on Youtube. Simply go to Youtube
and in the search bar type in StatQuest Logistic Regression
-----------------------------------------
MODEL ABBREVIATIONS
GBM - Gradient Boosting Machine (classification)
LightGBM - LightGBM (classification)
NeuralNet - Neural Network (classification)
RandForest - Random Forest (classification)
RForestReg - Random Forest (regression)
HuberReg - Huber Regression (regression)
KNN - K Nearest Neighbor (classification)
AdaB - AdaBoost (classification)
LogRegr - Logistic Regression
NBay - Naive Bayes (classification)
GBMreg - Gradient Boosting Regression
LogGAM - Logistic Generative Model (classification)
LinGAM - Linear Generative Model (Regression)
XGBoost - Extreme Gradient Boosting (classification)
XGBReg - Extreme Gradient Boosting Regression
Voting - Combined ensemble voting predictions from your choice of models
histGBM - GBM classifier that bins feature values, faster than GBM
RidgeReg - Ridge Regression (regression)

TTDrift - Train Test Drift measure of TT distribution difference
-----------------------------------------
INPUT FEATURES
*** required with same name or other name if user supplying own data
raceId - Number identifying individal races ***
trackTimeDate - Useful for those that want to merge in own data
raceType - type of race eg Handicap
RTypeLTO - race type last time out
raceSex - Male only = 1 mixed = 2 female only = 3
track - track
year - year of race
month - month of year
week - week of year
raceClass - race class
raceDist - race distance
surface - Race surface eg turf
going - race going
raceValue - race win purse / 1000
draw - stall draw
drawValue - Value of draw at track and dist
runners - Number of runners in race
horse - horse name
weightDiff - top weight minus horse weight
OR - Official Rating
bestORDiff - Best win OR (turf/AW) minus todays OR
ORDiff - Difference between top OR in race
nat - horse nationality
avgBeat - Lifetime horses in front / horses behind
goingDiff - 1 means yes 0 means no from last race
goodRunGoing - On todays going previous good runs / runs
classMove - race class minus last race class
weightDiffLto - todays weight minus weight LTO
runnersPrev - number of runners in previous race
runnersRatio - runners in previous race / runners today
hgToday - wearing headgear in current race 1 = yes 0 = no
chgHg - change of headgear from last race 1 = yes 0 = no
hgFirst - First time headgear 1 = yes 0 = no
hgChanges - Count of headgear changes from all prev' runs
weight - horse weight / topweight
pdsBtnLto - how far beaten in last race in pounds
daysLto - days since last run
daySinceGR - days since last good run
prevLto - days between last run and previous run
age - horse age
prevRaces - Number of previous races for code ie Flat
exposure - Number of previous races / race average
hasPlacedTrack - has placed form at the track
trainer - trainer name
trSwitches - horse lifetime trainer switches
TRSR - Trainer strike rate at time of race (min 50 runs)
TRinrace - trainer strike rate (SR) / top TRSR in race
TRTrackPCent - trainer track wins / trainer track runs
TRrolling - rolling win & place SR, sample based on trainer runs
TRageRatio - SR% with this horse age / TR overall SR%
TRPrizeRatio - Trainer average win prize money / race prize
JockSR - Jockey SR at time of race (min 50 runs)
avgJockSR - Average Jock SR derived from all previous runs
avgJockRatio - ratio of this jock SR to all previous average SRs
jockRatio - this jock strike rate / previous jock strike rate
Jockinrace - Jock strike rate / top Jocksr in race
JockRolling - rolling win and place SR, roll based on jockey runs
SireSR - Sire strike rate at time of race
Sireinrace - sireSR / top sireSR in race
SireDistAge - % of placed runs at distance by sire for 2yo, 3yo+
SireSurf - placed runs on surface turf fibre poly / surf runs
DamSireSR - Dam sire strike rate at time of race
DamSireSurf - placed runs on surface turf fibre poly / surf runs
Sex - sex of horse eg g c f m
SexMF - sex M male F female
beatLTO1 - LTO runner count minus finPos / runner count
beatLTO2 - as above for second last run
beatLTO3 - as above for third last run
entries - number of 5 days entries for horse
jockSame - 1 if same jock to previous run 0 if not
jockMinus - 1 if jock SR% is less than last run jockey
distUp - 1 if race dist greater than last race dist 0 if not
distSame - 1 if same race dist to previous run 0 if not
goodRunRate - ratio of good runs to runs
preFinPos - All previous fin positions / Previous opponents
preFinPos3 - Last 3 fin positions / last 3 oppponents
prevBFSP - BFSP in last race
logPrevBF - natural log of chance according to last BFSP
BFSP - Betfair SP in this race ***
finClose - SeeHelp 1 if horse won or < rDist/10 lgths of winner
can be used as alternative to finPos as target to give more balanced data
do not use as an input feature
priceDrift - 1 if pre race average betfair price < BFSP
priceDriftRatio - BFSP / average betfair price
paceDiff - pace figure from last race minus pace from pelutimate
paceFig - RunStyle from last flat race 0 heldUp to 5.6 madeAll
avgRacePace - average race pace figure for this race
avgClassPace - average winning pace fig for handicap class
avgTrackWinPace - average track winn pace fig for handicaps
horseSize - average = 1 bigger horse > 1 smaller < 1
IPDropLTO - 1 if horse dropped below its BFSP in running LTO
IPDropPercent - % of horse IP Min < BFSP all prev races
dropLast3Avg - average of last 3 runs in running drop %
IPDrop20 - Alt' target (BFSP minus IPMin) / BFSP = 1 if >= 0.2
IPDrop40 - Alt' target (BFSP minus IPMin) / BFSP = 1 if >= 0.4
IPDrop60 - Alt' target (BFSP minus IPMin) / BFSP = 1 if >= 0.6
lgthsBtn - lengths behind winner or zero if won this race
pdsBtn - pounds behind winner,alternative target feature
finPosFull - full numeric finishing position
placed - 1 means horse placed,alternative target feature
IPReturn - finPos minus (1/BFSP) alternative target feat
finPos - 1 for winner 0 for loser ***
-----------------------------
MISSING DATA
Some fields may have missing rows eg daysLto if a horse has never run before
This is not unusual in Machine Learning problems. MySportsAI replaces missing
values or NaN's as they are called with the median for that column and that median is
applied going forward to test data and daily decs data. You can specify other
replacement methods eg mean if you wish.
-----------------------------
USING YOU OWN DEC'S
If you wish to run your model against your own daily runner declaration file you
can do this by
1. loading your saved model in MySportsAI
2. Click Run Model
3. For the supplied test file select your dec's file
4. Save test results
<a href = "Log In">More useful short videos</a>
 
MySportsAI MySportsAI How do your subscribers run different strategies automatically using your app?

Since you utilize ML models, every race requires input features for predictions; therefore, this entire process must be automated. I assume the bets are placed on Betfair Sportsbook Exchange—does your app handle that execution?
 
MySportsAI MySportsAI How do your subscribers run different strategies automatically using your app?

Since you utilize ML models, every race requires input features for predictions; therefore, this entire process must be automated. I assume the bets are placed on Betfair Sportsbook Exchange—does your app handle that execution?
The software does not automatically place bets for you, it allows you to build models and then run those models on todays data to produce probabilities/ratings. I personally automate my bet placements but that is using my own code and the Betfair API. I can possibly see where you are going with this and it makes perfect sense
 
The test of the 'Form Trajectory Strategy' yesterday went very wrong, so I had to switch to the 'Crowd Trade Strategy.'

However, I did manage to implement new data parsing code for RaceIQ. This now provides me with a significant amount of comprehensive data for any given race: race card details, horse performance metrics, and the last-race data for every participating horse—including their individual metrics and opponent data within the RaceIQ system.

Today, I need to read ELO rating posts and similar resources to gather ideas for my new data strategy.
 
The test of the 'Form Trajectory Strategy' yesterday went very wrong, so I had to switch to the 'Crowd Trade Strategy.'

However, I did manage to implement new data parsing code for RaceIQ. This now provides me with a significant amount of comprehensive data for any given race: race card details, horse performance metrics, and the last-race data for every participating horse—including their individual metrics and opponent data within the RaceIQ system.

Today, I need to read ELO rating posts and similar resources to gather ideas for my new data strategy.
You should consider different k values for different racecodes because they are all quite different.
Also, whilst predictive, Elo is not optimal for horse-racing without so much modification as to render it something else entirely. Elo was designed explicitly to measure outcomes featuring 2 participants.
 
A Ajit What do you mean by 'k values'? Regarding my data, I have obtained racecourse profile information that details how horses perform when ridden.

View attachment 173357
StefanBelo StefanBelo
Just a thought Stefan but you may want to set up an "Early Position Figure" or "EPF" metric based on those four categories you see in that graphic ie - led, prominent, mid-div & rear
some of us call these "pace" figures but technically they only define "Early" Position in a race - there is no actual speed or pace element

setting up an EPF metric
Normally with that kind of data (historical records of certain "early race positions") you may want to actually apply the structure to the runners in the races your looking at currently
you can set up a simple rating system based on the four categories you see in that historical data
which could go something like this
Held Up/Rear - 1.00 point
Mid-Div - 2.25 points
Prominent - 3.75 points
Led/Frontrunner - 5.00 points

The idea is to parse the "in-run" comments of say the last 3-4 runs and award the above scores based on their early positioning in those races
and then either average or sum the scores
OR you may want to apply a simple recency weighting to the scores based on LR1, LR2, LR3, LR4 where LR =
Last Race and their in chronological order
for a weighting just use the reciprocal of LR Number
so LR1 = 1/1 = 1.00
LR2 = 1/2 = 0.50
LR3 = 1/3 =0.333
LR4 = 1/4 =0.25
Multiply each horses score by the weighting and then divide by sum of weights (=2.08)

so if a horse was a leader (say you decide on 5 as a score) over the last 4 races
weighted scores are

LR1 = 5 *1.00 =5.00
LR 2 = 5*0.50 = 2.50
LR 3 = 5*0.33 = 1.65
LR 4 = 5*0.25 = 1.25

sum scores = 10.40
then divide by sum of weights = (10.40/2.08)
which equals a final recency weighted EPF of 5.00

Use dynamic weighting - so if you decide to use the last 4 runs, a horse may only have 2 or 3 runs which means you still apply the weights but make sure your only dividing by total sum of 2 or 3 weights and not 4

do this for all horses in a race
you'll find that there will be plenty of variation between early runstyles and races as horses are not as consistent as the one in the example
but generally these figures highlight the potential leader/prominent horses as well as those that run at the back/rear in a race and works reasonably well as a starting point - the scores can be mapped graphically creating a "speed/pace" map that can be a visual aid for picturing raceshapes etc
The cumulative scores of ALL runners in a race can also become a "race-level" metric that can categorise "Pace or Early Pressure" within a race
for example 2 10 runner races that have the following horses in the top 4 are probably going to be "different" races in terms of "early" shape
Race 1 Top 4 Scores
4.50
2.10
1.80
1.65

Race 2 Top 4 Scores
5.00
4.35
4.10
3.85

at race level the second race has potentially much more pressure at the front end (assuming the horses concerned run to their historical early positions - they don't always lol)
whilst the first race could potentially go "lone front runner" with very little pressure applied from the other runners


Note * some (low %) of the in-race comments can be a bit "unstructured" and don't define the actual runstyle - Timeform's in race comments (if you can get them) are much better to use for this kind of thing as they follow a more uniform pattern of definitions of early position but generally most of the in-run comments from the various sources "PA" & Racing Post" are generally ok


If you have a database of results you may wish to apply the scores to each horse in the results - then its just a matter of extracting the scores based on the Last Run Criteria and they carry forward to todays race

BTW - that simple little recency weighting technique above works pretty well as a starting point and "usually" makes ANY scoring and rating metrics a little stronger
There are of course more advanced "weighting" algorithms but have deliberately kept it simple as an introduction


Btw i see your saying that you can now extract data from RaceIQ - if it's the individual sectionals then you can easily make them "cumulative" and from that you can extract the exact position of each runner in a race at each furlong pole so there would be no need to "parse" the in race comments - if you can do this it will increase the accuracy of the figures - also means your using a uniformed point in a race to take the measurement (eg - second furlong) rather than relying on a race-readers in-race comment.
 
Last edited:
You should consider different k values for different racecodes because they are all quite different.
Also, whilst predictive, Elo is not optimal for horse-racing without so much modification as to render it something else entirely. Elo was designed explicitly to measure outcomes featuring 2 participants.
This is true - ELO is actually a pretty messy construct when adapted to multi-competitor sports like racing when compared to a true handicapping model.
Was originally designed for rating chess players and as chess is 1v1 can be adapted directly to 1v1 sports pretty easily but racing would need manipulated quite heavily.
Some of Dave Dave 's values were very questionable and raised an eyebrow in the opening post in that ELO thread although i'm not here to critique anybody's methods - i'll leave that to the bloggers and "experts"

From a "handicapping" perspective though i will say these don't make any real sense and i can actually prove that being a eh ...private handicapper


ELO 1.png
BraveNation.png
ElO 1.1.png
Masego 1.png

for example Masego up there strictly on form on that run has ran 2lb below his BHA mark of 51 behind an improved winner, He was beaten 9 lengths which was corrected to 7.51 given the archaic way that the BHA treat beaten lengths
The third was a further (corrected) 13.7 lengths away

Masegosouthwell24.10.png
If you remove the winner you can only get a possible range of figures that range from 48 to 52 (and that's using all 7 runners that finished directly below him) so the range is pretty tight - an extremely high probability that his figure MUST fall in that range.
The historical median Class 6 Southwell handicap figures again for 1st, 2nds, 3rds, 4ths & 5ths when plugged in all suggest he's ran to 49-51 which is an even tighter range.
You couldn't possibly say it was a strong race given that the mid point of margin beaten was just over 4.00 seconds and 5 of the 14 runners actually returned negative performance ratings which tells you how far back they were when they can't even reach a benchmark of 0.
Had a look and the timefigure returned was around 9lbs below ability (winner ran to 62 , timefig 53)
with the sectionals upgrading Masego slightly by just over a pound - early pace was way too fast which Masego was very close to and was out on his feet at the finish coming home in the final three furlongs over 2.3 seconds slower than the winner
A pound upgrade then and Masego has ran to a pound below his BHA mark of 51 and a performance rating of 50
BHA have him running around 3lbs below his mark but given that they standardize their Lengths Per Second if they changed their methodology they would probably concur. Racing Post handicappers also agree that he has run slightly below his mark

No true handicapper in the world would have him going up 25 lbs like the ELO has done there
it's very possible that the ELO points to pounds conversion is massive but again noticed that Dave calculates race/field averages and that there was 19lbs between a class 4 and a class 6 at Southwell which nearly reflects BHA (18 lbs) even though his ratings are scaling at a range of 93 to 112 between those classes. If the differences between races are similar why are horses individually being bumped up when in reality they are running near or below form in very ordinary races ?

can show the others but would just be long winded handicapping jargon
the point then ??
I'd be very wary from the get-go if i was implementing an ELO type rating given that we know it was designed for 1 v 1 type sports and contests
Introducing pounds to length conversions and rating scales would need lots of testing to see if the constructs and conversions are replicating reality also remember that it is a loop-type rating which feeds back information on itself so you could possibly end up with a set of ratings down the line that amount to an exercise in playing with numbers rather than anything real and predictive
Modeling real life racehorse performance shows that many more horses run under their ceiling of ability rather than above which means that ratings that measure and normalize performance would be heavily skewed to the left rather than anything approaching a bell curve type normal distribution. Handicappers that have been rating horse populations for years know this which probably tells you that it would be very difficult to come up with an automated "algorithm" or "system" that could replicate their work.
There still is a lot of manual work involved where you have to subjectively make decisions.
And thank fuck there still is ....as AI and the robots can't have everything. :)
 
Last edited:
StefanBelo StefanBelo
Just a thought Stefan but you may want to set up an "Early Position Figure" or "EPF" metric based on those four categories you see in that graphic ie - led, prominent, mid-div & rear
some of us call these "pace" figures but technically they only define "Early" Position in a race - there is no actual speed or pace element

setting up an EPF metric
Normally with that kind of data (historical records of certain "early race positions") you may want to actually apply the structure to the runners in the races your looking at currently
you can set up a simple rating system based on the four categories you see in that historical data
which could go something like this
Held Up/Rear - 1.00 point
Mid-Div - 2.25 points
Prominent - 3.75 points
Led/Frontrunner - 5.00 points

The idea is to parse the "in-run" comments of say the last 3-4 runs and award the above scores based on their early positioning in those races
and then either average or sum the scores
OR you may want to apply a simple recency weighting to the scores based on LR1, LR2, LR3, LR4 where LR =
Last Race and their in chronological order
for a weighting just use the reciprocal of LR Number
so LR1 = 1/1 = 1.00
LR2 = 1/2 = 0.50
LR3 = 1/3 =0.333
LR4 = 1/4 =0.25
Multiply each horses score by the weighting and then divide by sum of weights (=2.08)

so if a horse was a leader (say you decide on 5 as a score) over the last 4 races
weighted scores are

LR1 = 5 *1.00 =5.00
LR 2 = 5*0.50 = 2.50
LR 3 = 5*0.33 = 1.65
LR 4 = 5*0.25 = 1.25

sum scores = 10.40
then divide by sum of weights = (10.40/2.08)
which equals a final recency weighted EPF of 5.00

Use dynamic weighting - so if you decide to use the last 4 runs, a horse may only have 2 or 3 runs which means you still apply the weights but make sure your only dividing by total sum of 2 or 3 weights and not 4

do this for all horses in a race
you'll find that there will be plenty of variation between early runstyles and races as horses are not as consistent as the one in the example
but generally these figures highlight the potential leader/prominent horses as well as those that run at the back/rear in a race and works reasonably well as a starting point - the scores can be mapped graphically creating a "speed/pace" map that can be a visual aid for picturing raceshapes etc
The cumulative scores of ALL runners in a race can also become a "race-level" metric that can categorise "Pace or Early Pressure" within a race
for example 2 10 runner races that have the following horses in the top 4 are probably going to be "different" races in terms of "early" shape
Race 1 Top 4 Scores
4.50
2.10
1.80
1.65

Race 2 Top 4 Scores
5.00
4.35
4.10
3.85

at race level the second race has potentially much more pressure at the front end (assuming the horses concerned run to their historical early positions - they don't always lol)
whilst the first race could potentially go "lone front runner" with very little pressure applied from the other runners


Note * some (low %) of the in-race comments can be a bit "unstructured" and don't define the actual runstyle - Timeform's in race comments (if you can get them) are much better to use for this kind of thing as they follow a more uniform pattern of definitions of early position but generally most of the in-run comments from the various sources "PA" & Racing Post" are generally ok


If you have a database of results you may wish to apply the scores to each horse in the results - then its just a matter of extracting the scores based on the Last Run Criteria and they carry forward to todays race

BTW - that simple little recency weighting technique above works pretty well as a starting point and "usually" makes ANY scoring and rating metrics a little stronger
There are of course more advanced "weighting" algorithms but have deliberately kept it simple as an introduction


Btw i see your saying that you can now extract data from RaceIQ - if it's the individual sectionals then you can easily make them "cumulative" and from that you can extract the exact position of each runner in a race at each furlong pole so there would be no need to "parse" the in race comments - if you can do this it will increase the accuracy of the figures - also means your using a uniformed point in a race to take the measurement (eg - second furlong) rather than relying on a race-readers in-race comment.
RSB used to assess them based on winning races only but you could adopt a 'ran well' option both eliminate the not trying races
 
Back
Top